
Introduction
The National Ranchland Property Index® is a market-weighted benchmark of the US Ranchland Property Market. In response to a growing demand by individual and institutional investors to invest in Agricultural related property investments, Ranchland Capital Partners® has created the National Ranchland Property Index® (“NRPI”) given the lack of available benchmark data on the Ranchland segment.
The NRPI seeks to track performance of the US Ranchland property market on a total return basis by using publicly available data provided by the United States Department of Agriculture (USDA). This includes their annual census data on price per acre for US Pastureland, and annual census data on cash rents received per acre.
Highlights
The index is designed to track the market weighted performance of national ranchland properties in the United States. For this, the index is rebalanced annually to align with the frequency of data reported by the USDA on both land prices per acre, and cash rents received per acre on US Pastureland. Each US State has a weight equal to its total acres of pastureland reported by the USDA, multiplied by its average price per acre, divided by the total market value of pastureland in the US.
The NRPI has the following features:
- Official index calculation and dissemination by Ranchland Capital Partners®.
- The index calculation begins with a value of 1,000 on December 31st, 1997.
- The annual rebalancing is reasonable, balancing investability and representation given the long-term nature of the asset class.
- The index provides insights into total returns on US Ranchland, which are difficult to calculate given limitations on price discovery given non-disclosure laws in certain US states.
- USDA “Pastureland” is defined as “Pastureland supports introduced or domestic native forage species and is used primarily for livestock production.”
- The methodology was created by Ranchland Capital Partners® to achieve the prior mentioned goal of measuring the underlying performance of US Ranchland. Any changes to or deviations from the methodology are made in the sole judgement and discretion of Ranchland Capital Partners® so that the index continues to achieve its objective.
Eligibility Criteria
Index Eligibility
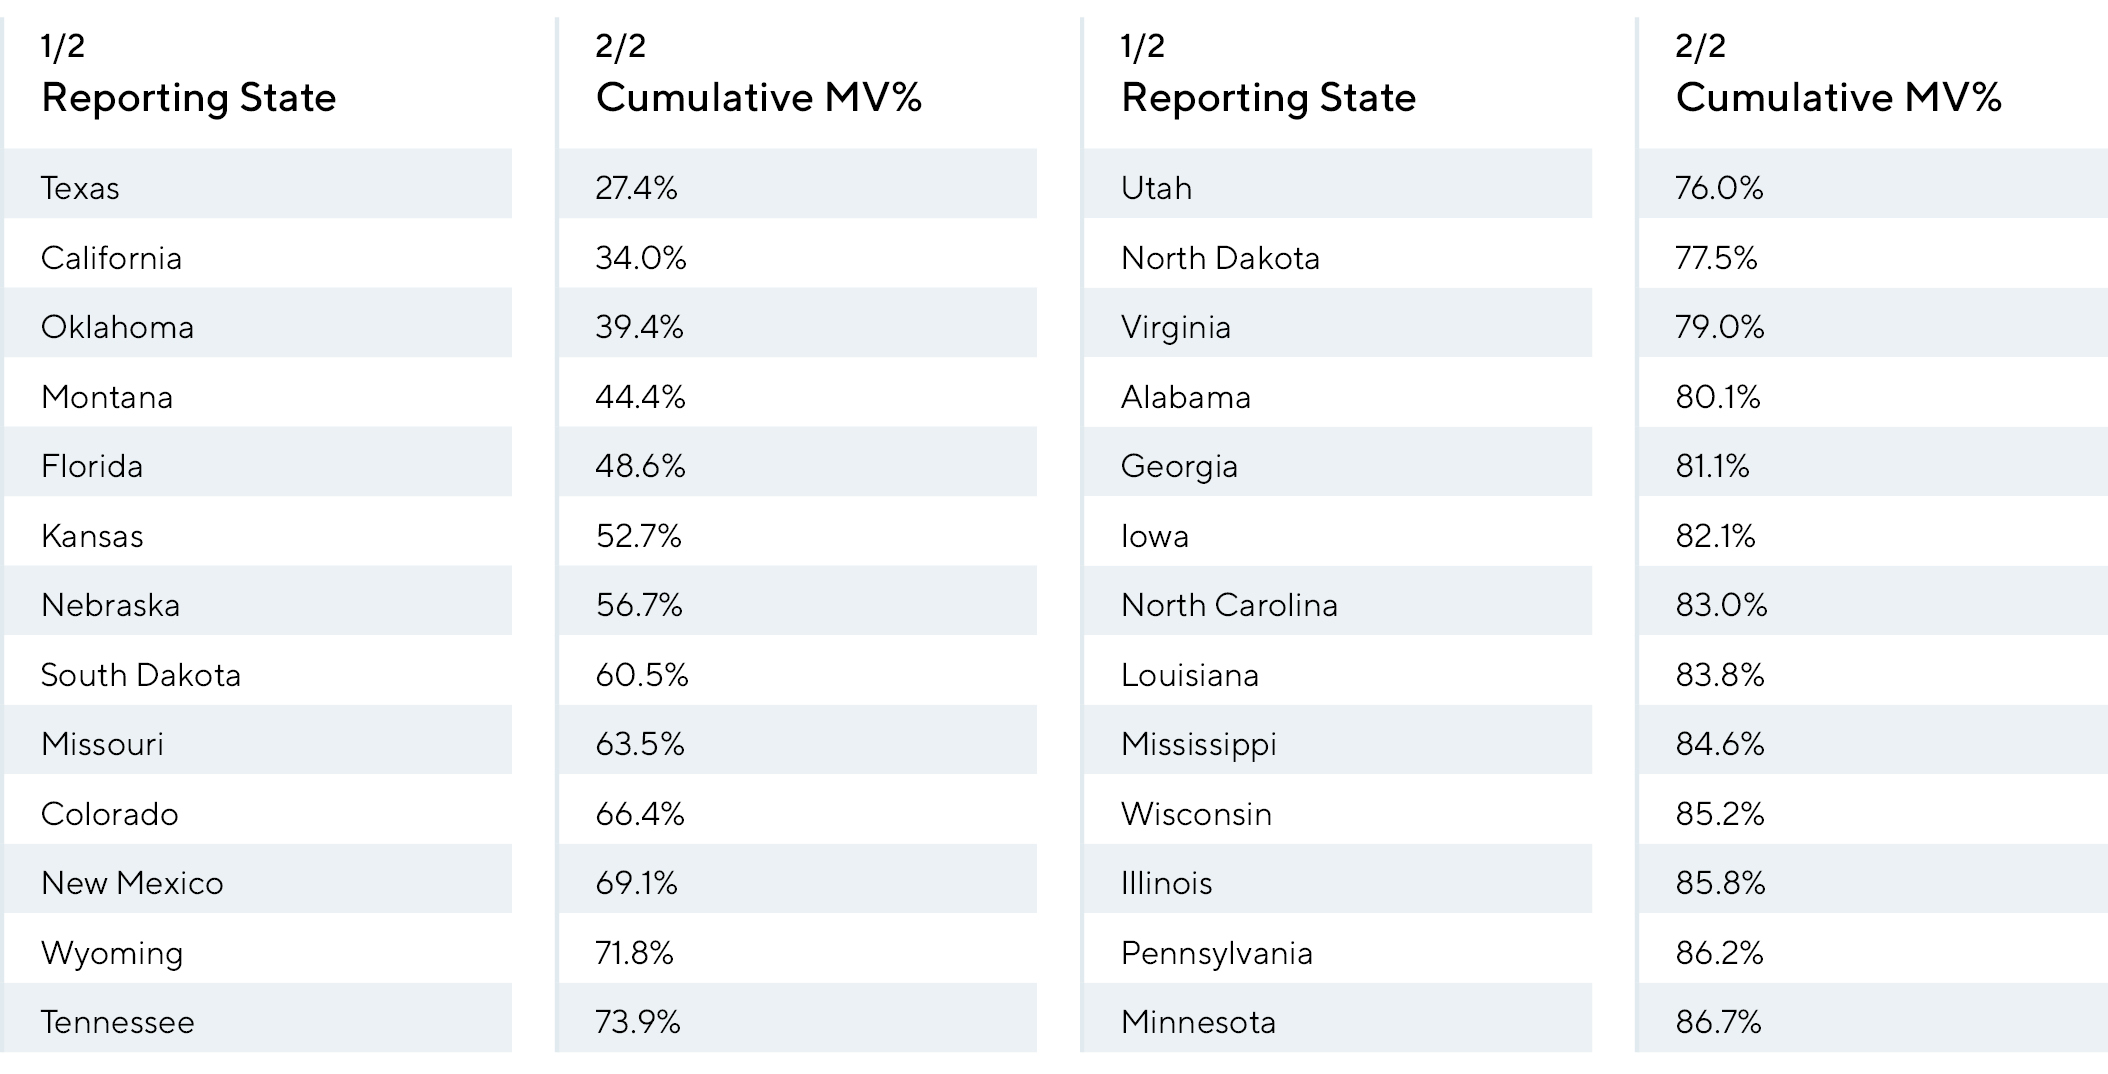
The NRPI compiles publicly available USDA data through their National Agricultural Statistics Service (“NASS”) found here. All index constituents are US States that report pastureland and cash rent data to the USDA annually. States that do not report this information or that do not participate in the annual census are excluded from the index. The states that historically have not participated in the annual NASS data collection cumulatively represent less than 14% of the total US pastureland values as of 2024 and are generally not representative of the US Ranchland market when you also consider their contributions to annual livestock production in the US.
We classify “Eligible” index constituents as the following US States:
- At least 20 consecutive years of actual cash rent prices per acre reported in the annual USDA NASS Census.
- At least 20 consecutive years of survey data representing total pastureland acreage in production within the State.
- At least 20 consecutive years of annual census pastureland price per acre data for State.
The following states met this eligibility criteria during the index construction:
Index Construction
Approach
The index series is market-capitalization weighted and calculated in two phases to develop a total return benchmark index, comprised of a price return calculation, and an income return calculation with adjustment for property taxes. The resulting index construction can be considered a passive benchmark, whereas an investor buys land, and leases it out to an operator for cash rents.
Market Value Calculations
We first remove all ineligible states from the universe. Refer to Eligibility criteria for our approach to this part of the index construction.
We calculate the market capitalization of each eligible State based on reported ranchland acreage in production, and reported prices per acre for that year.
![]()
Then we calculate the total market capitalization of the eligible states by summing the individual market capitalizations to get the “national market capitalization” figure.

Index Constituent Weight Calculation
To determine the state’s relative weighting in the index, we divide the state’s market cap by the national market cap:
![]()
Price Return Calculation
The price return is a simple holding period return calculation, ran for each state in the index universe. The holding period return takes the current year-end reported price per acre, and divides it by the prior year-end’s price per acre, then subtracts 1 to get a percent price return.
![]()
Income Return Calculation
First, we adjust the reported cash rent per acre for each eligible state downward by estimating property taxes using the following formula:

The -2.33 is added to the reported cash rent price per acre to come up with an adjusted figure, representing the passive income from owning a ranchland property. While there are additional factors that may increase or decrease the annual income to passive ranch ownership, they are largely subjective and highly dependent on the management style of the operator.
To calculate each constituent’s income return component, we take the adjusted cash rent per acre in thecurrent period, and divide that figure by the previous period’s reported land price per acre.

This standardizes the reported cash rent in dollars per acre into a percentage return figure which can thenbe added to the price return.
Total Return Calculation
The total return formula is a simple addition of the price return for the period plus the income return for the period. The total returns are calculated for each state using the methodologies described above.
![]()
Index Total Return Calculation
The total return for the index is the summation of the market-value weighted returns for each state:
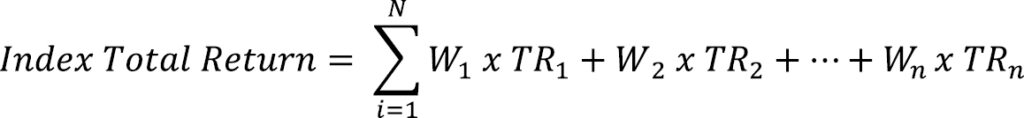
Where W1 is the constituent weight for the state, and TR1 is the total return for the state during that period.
Index Value Calculation
The initial index value was set at a base level of 1,000 on December 31, 1997. The index value for the current period is simply the prior year-end index value, multiplied by 1 plus the current year total index return:
![]()
In order to maintain index series continuity, our approach to calculating the total return index allows for the addition or subtraction of US States depending on reported data going forward. The historical index calculations assume the eligible state list referenced in Eligibility Criteria above is held static given they are the only states which reported both price and cash rent data for all years going back to the base year of 1997.
Data Sources
We use the USDA Quick National Agricultural Statistical Service (NASS) tool to obtain annual data for total pastureland acres, price per acre, and cash rents per acre by state. They can be found here:
- US Pastureland acres by state: sourced here
- US Pastureland price per acre by state: sourced here
- US Pastureland cash rents received by state: sourced here
- Property Tax Adjustment data was derived through various sources and is assumed to be representative of the average annual property taxes. Additional source information can be found here, here, and here.
Index Maintenance
Rebalancing
The index is rebalanced annually to align with the reporting frequency of the USDA data. At each rebalance, price and income data are weighted based on the year-end market values of Pastureland within each state. As the number of acres in production and average state-wide price per acre change, the weightings in the index will change.
Currency of Calculation
The index is calculated in U.S. dollars.
Index Actions
Constituent Change: When a constituent of the index is no longer eligible, or if a constituent that was previously excluded from the index becomes eligible based on our eligibility criteria, we simply make the adjustment to the available constituents when calculating the current period’s national market cap and subsequent state market cap weightings. The updated weights are used in the calculation of total returns, and the current period index value reflects the change.
Property Tax Changes: We use the annual Montana property tax rate for agricultural land as a proxy for national property tax rates, given lack of available state-by-state data and to make a simplifying assumption for the downward adjustment to income. If the property tax rate changes, the updated tax rate will be used in the cash rent income adjustment.
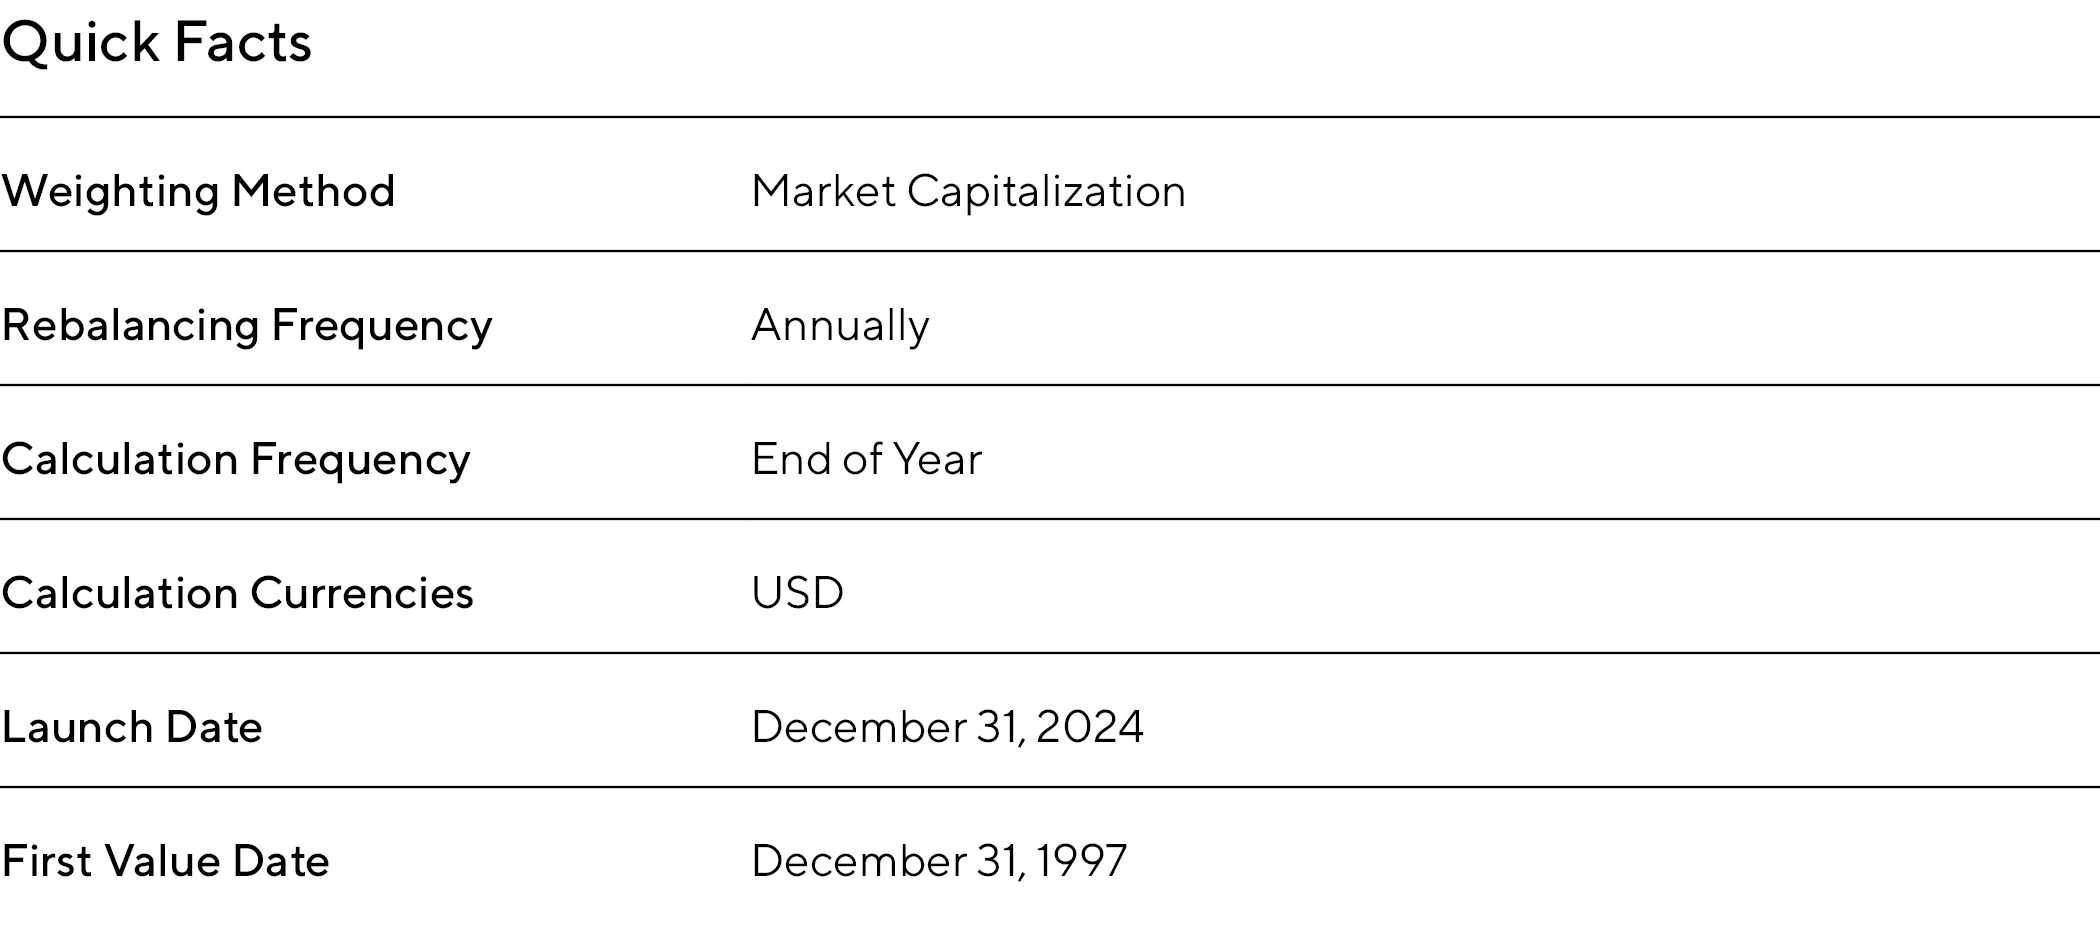
Index Data
Quick Facts
All information presented prior to an index’s Launch Date is hypothetical (back-tested), not actual performance, and is based on the index methodology in effect on the index launch date. Back-tested performance reflects application of an index methodology and selection of index constituents with the benefit of hindsight and knowledge of factors that may have positively affected its performance, cannot account for all financial risk that may affect results and may be considered to reflect survivor/look ahead bias. Actual returns may differ significantly from, and be lower than, back-tested returns. It is not possible to invest directly into an index. Past performance is not an indication or guarantee of future results.
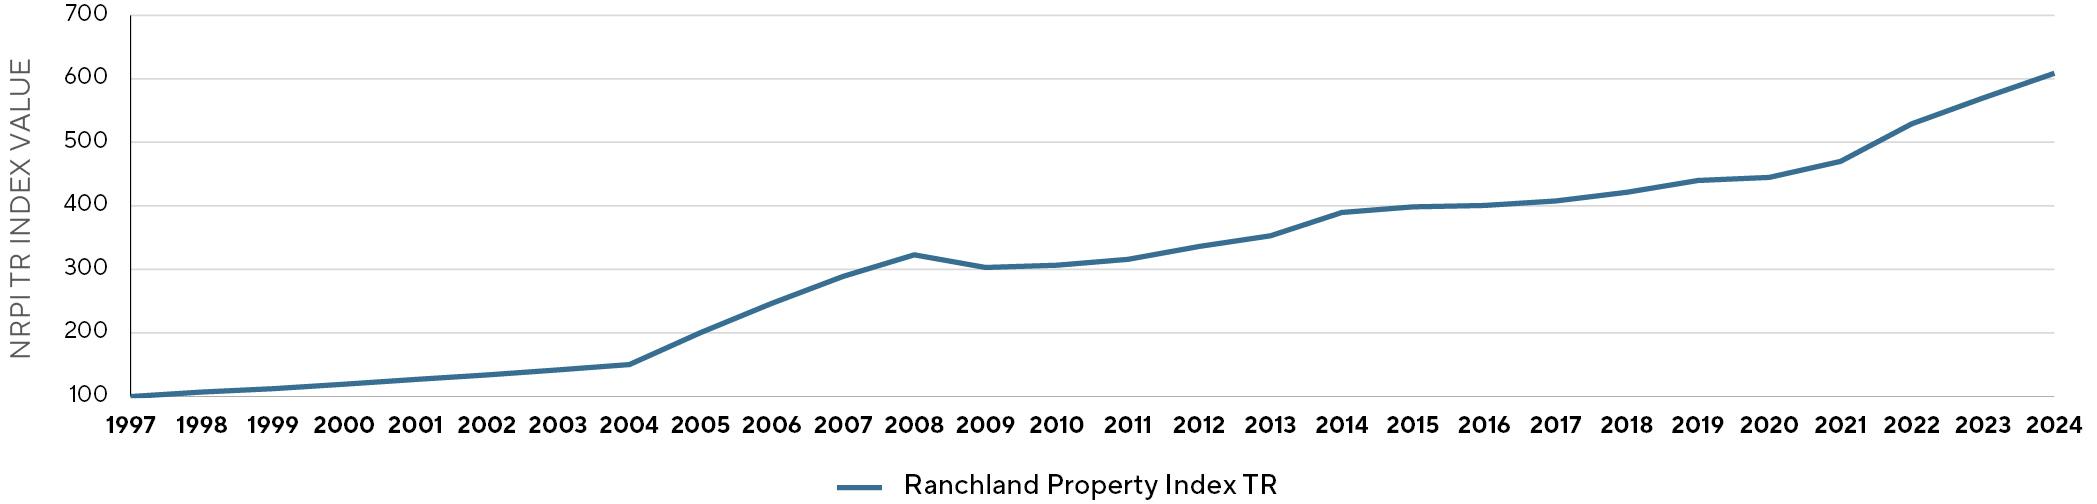
Historical Index Performance
Depending on index launch date, all charts below may include back-tested data
Annualized Performance
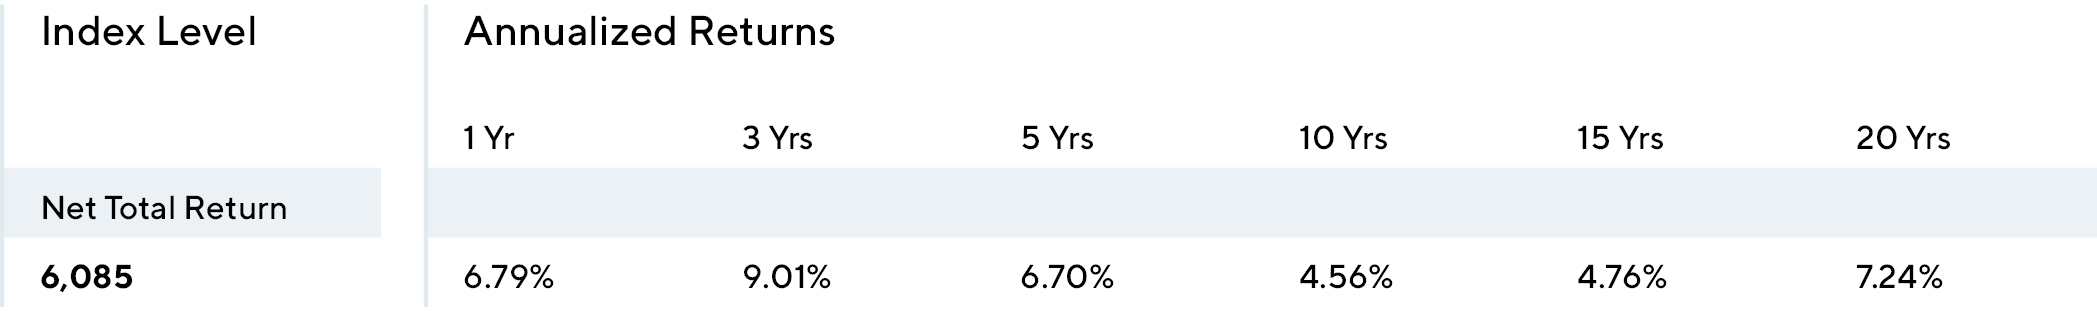
Disclosure: all returns prior to December 31, 2024 are hypothetical backtested returns on the index, refer to risk section.
Calendar Year Performance
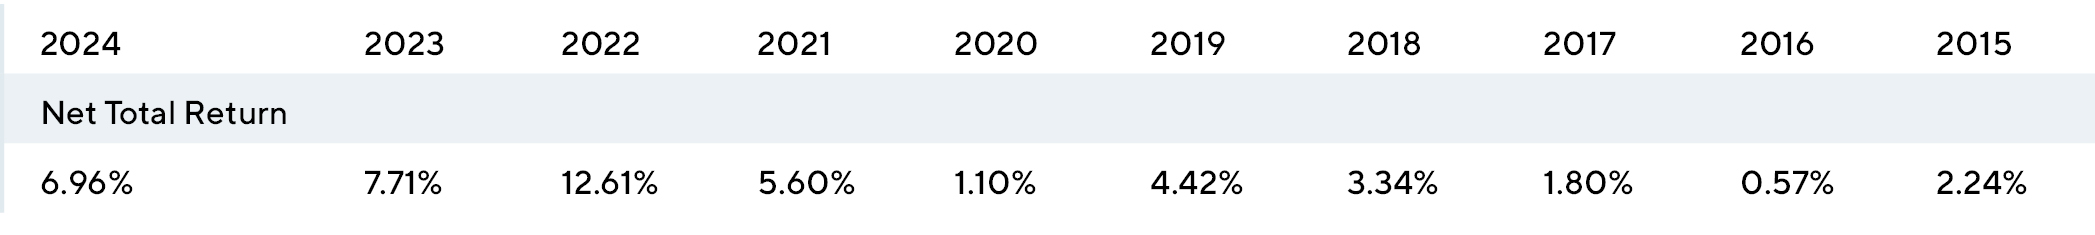
Disclosure: all returns prior to December 31, 2024 are hypothetical backtested returns on the index, refer to risk section.
Risk
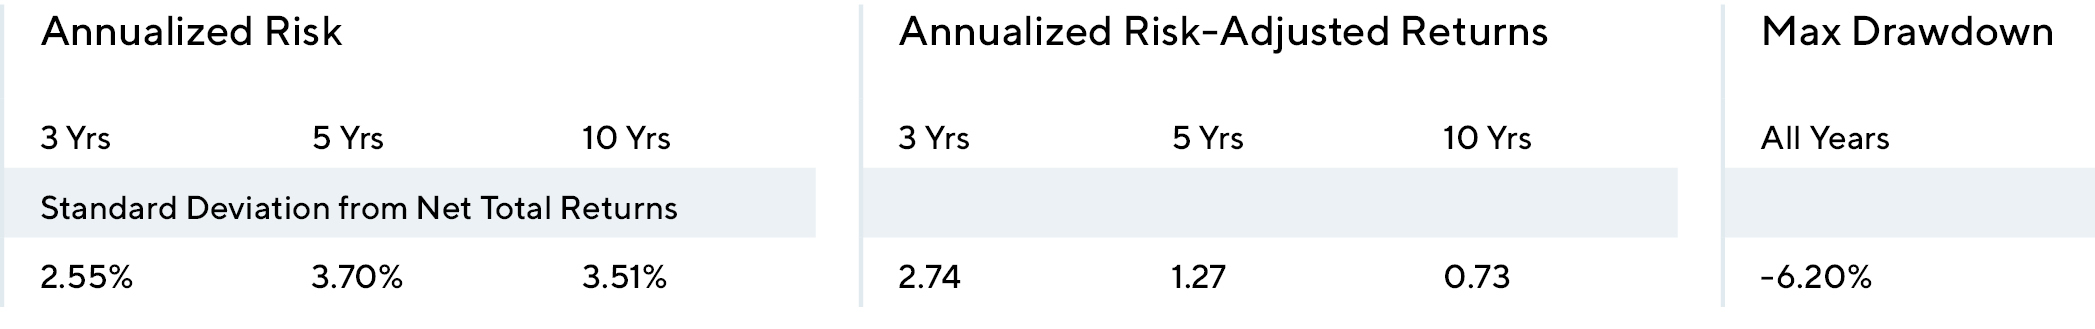
Risk is defined as standard deviation calculated using annual values. Risk free rate assumed to be 2.0% for risk-adjusted return calculations.
Correlations
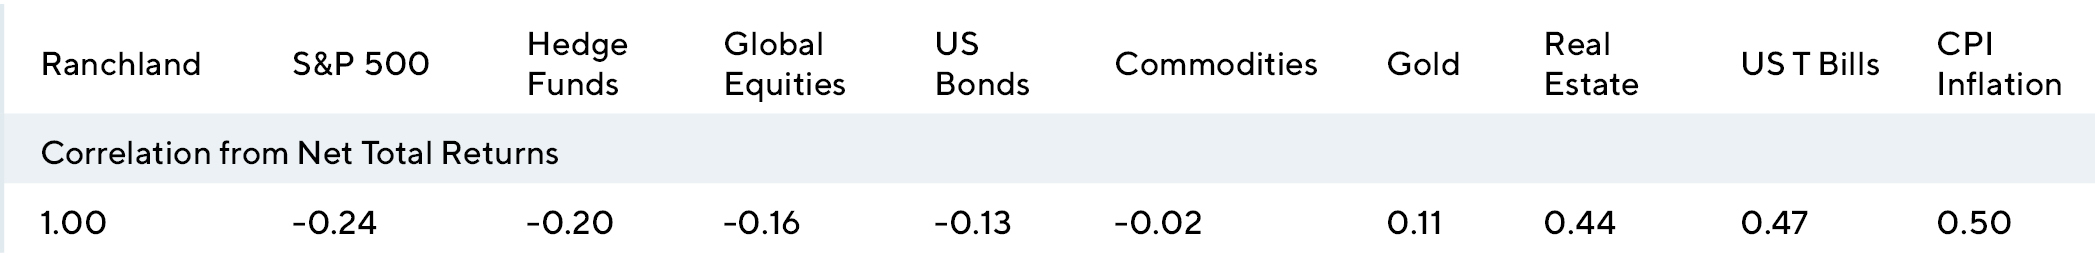
Correlations are calculated as historical correlations of total returns from 1997 to 2024, correlating the National Ranchland Property Index® to the following indices: Sources: US Bonds: Bloomberg Barclays US Aggregate Bond Index; US Equities: S&P 500 TR Index; Real Estate: NCREIF National Property Index; Global Stocks: ACWI Ex-US Index; Hedge Funds: CISDM Equal-weight Hedge Fund Index; Gold: Historical Price per Ounce; Commodities: Bloomberg Commodities Index (TR); US T Bills: 3-month Treasury Bill Index; Ranchland: National Ranchland Property Index® TR; CPI Inflation: US CPI Inflation.
Index Governance
The index is maintained by Ranchland Capital Partners®. There are three managing members of the company; all are full-time professional members of RCP. Due to the infrequent rebalancing and data limitations on the index, ongoing governance and changes to the index are unlikely to occur more frequently than annually during the annual reconstitution and rebalance. Thus, we have engaged a third-party verification service provider to review the index performance calculations annually, including a formal verification of back-tested index performance.
The NRPI index is a new index, and does not have any publicly traded products linked to its performance.
Index Dissemination will be annually, published on the Ranchland Capital Partners’ website, https://ranchlandcp.com.
For information on Quality Assurance and our Third-Party Verification provider, Alpha Performance Verification Services, please contact RCP at [email protected].
Index Limitations
The NRPI, while designed to provide a robust and market-weighted measure of US Ranchland performance, is subject to the following limitations:
- Survey-Based Data
The index relies on USDA survey data, which is not derived from transactional market data. Survey responses may reflect appraisals or estimations rather than bona fide, arms-length transactions. - Lag in Data Collection
Survey data reflects annual reported data and may not capture rapid changes in market conditions or short-term fluctuations in pastureland prices. - Potential for Bias
Survey results may be influenced by participant subjectivity or self-reporting biases, which could affect the accuracy of reported price per acre. - Methodological Constraints
The methodology relies on weighted averages of survey data, which may not fully account for structural changes or variations in liquidity across different Ranchland markets. - Investability
The index represents passive exposure to national Ranchland, which often exceed $10 million USD in market value for a single property. Based on broker reports and publicly available sales data, such as Montana Land Source and other similar digital listing services, the annual deal flow in this segment of the market is estimated to be between $3 billion and $5 billion dollars in the US annually. While investors could invest in the index through passive ranch ownership, lack of liquidity and high minimum investment sizes may create frictions for non-institutional investors seeking exposure.
This index should be used as a broad indicator of pastureland market trends and performance, recognizing the inherent limitations of the data source and methodology. Users are advised to consider supplementary data sources when conducting detailed performance analyses or making investment decisions.
Ranchland CP Contact Information


Disclaimer
© Ranchland Capital Partners®, 2024. All rights reserved. Ranchland Capital Partners® and the National Ranchland Property Index® are trademarks of Ranchland Capital Partners®, LLC. Redistribution, reproduction, or photocopying in whole or in part is prohibited without written permission. This document does not constitute an offer of services in jurisdictions where Ranchland Capital Partners® does not have the necessary licenses. All information provided by Ranchland Capital Partners® is impersonal and not tailored to the needs of any person, entity, or group.
Past performance of the National Ranchland Property Index® is not a guarantee of future results. It is not possible to invest directly in the index. Exposure to the asset class represented by the index may be available through investable instruments based on it. Ranchland Capital Partners® does not sponsor, endorse, sell, promote, or manage any investment fund or other vehicle that seeks to provide returns based on the index. Ranchland Capital Partners® makes no assurance that investment products based on the index will accurately track its performance or provide positive investment returns.
Ranchland Capital Partners® is not an investment advisor and makes no representation regarding the advisability of investing in any fund or vehicle. Investment decisions should be made only after carefully considering the risks detailed in an offering memorandum or similar document provided by the issuer. Inclusion of a property or asset in the index is not a recommendation to buy, sell, or hold such an asset, nor is it investment advice.
Ranchland Capital Partners® provides institutional access to the Ranchland property market through private funds and separate accounts focused on ranchland properties. While the National Ranchland Property Index® serves as a reference for tracking trends within the ranchland asset class, RCP does not aim to replicate, track, or benchmark its performance against the index. The index is independently maintained and does not directly influence the investment strategy, performance targets, or portfolio composition of Ranchland Capital Partners’ investments.
These materials are for informational purposes only, based on publicly available information believed to be reliable. No content in these materials, including index data, research, valuations, models, or other outputs, may be modified, reverse-engineered, reproduced, or distributed in any form without prior written permission. Content shall not be used for unlawful purposes. Ranchland Capital Partners® disclaims all express or implied warranties, including but not limited to those of merchantability or fitness for a particular purpose.
Ranchland Capital Partners®, its affiliates, and third-party data providers do not guarantee the accuracy, completeness, or timeliness of the information herein. Ranchland Capital Partners® and its affiliates are not liable for any errors, omissions, or the results obtained from the use of this information. This content is provided “as is” without warranty of any kind. In no event shall Ranchland Capital Partners® or its affiliates be liable for any direct, indirect, incidental, punitive, or consequential damages, including but not limited to lost income or profits, even if advised of the possibility of such damages.
IMPORTANT INFORMATION
Copyright© Ranchland Capital Partners, LLC 2024. All rights reserved.
This material is proprietary and may not be reproduced or distributed without Ranchland’s prior written permission. It is delivered on an “as is” basis without warranty or liability. Ranchland accepts no responsibility for any errors, mistakes, or omissions or for any action taken in reliance thereon. All charts, graphs, and other elements contained within are also copyrighted works and may be owned by Ranchland or a party other than Ranchland. By accepting the information, you agree to abide by all applicable copyright and other laws, as well as any additional copyright notices or restrictions contained in the information.
The views and information provided were created at various dates in time and unless otherwise indicated, are subject to frequent changes, updates, revisions, verifications, and amendments, materially or otherwise, without notice, as data or other conditions change. There can be no assurance that terms and trends described herein will continue or that forecasts are accurate. Certain statements contained herein are statements of future expectations or forward-looking statements that are based on Ranchland’s views and assumptions as of the date hereof and involve known and unknown risks and uncertainties that could cause actual results, performance, or events to differ materially and adversely from what has been expressed or implied in such statements. Forwardlooking statements may be identified by context or words such as “may, will, should, expects, plans, intends, anticipates, believes, estimates, predicts, potential, or continue” and other similar expressions. Neither Ranchland, its affiliates, nor any of Ranchland’s or its affiliates’ respective advisers, members, directors, officers, partners, agents, representatives, or employees, or any other person, is under any obligation to update or keep current the information contained in this document.
This material is for informational purposes only and is not an offer or a solicitation to subscribe to any fund and does not constitute investment, legal, regulatory, business, tax, financial, accounting, or other advice or a recommendation regarding any securities of Ranchland, of any fund or vehicle managed by Ranchland, or of any other issuer of securities. No representation or warranty, express or implied, is given as to the accuracy, fairness, correctness, or completeness of third-party sourced data or opinions contained herein, and no liability (in negligence or otherwise) is accepted by Ranchland for any loss howsoever arising, directly or indirectly, from any use of this document or its contents, or otherwise arising in connection with the provision of such third-party data.
Featured Articles

Using Heavy Tail Optimization to Evaluate the 2023 Milliman Study Allocation

The Relationship between Cattle, Sustainability, and Ecosystem Function

Why Now?

Hunting and Conservation: An Integral Relationship

Ranchland Economics under the New Trump Administration: An Initial Look.
")