
Portfolio Characteristics of US Ranchland: Returns, Correlations, Volatility, and Factor Risk Exposure Analysis
Introduction
For institutional investors, the allocation of funds within the Real Asset category often includes Farmland, Timberland, Infrastructure, Commodities, and Commercial Real Estate. Ranchland, however, has not been considered in this group of investments despite it having nearly double the land mass when compared to Farmland.
Ranchland’s potential role in a portfolio, as demonstrated in the rest of this paper, is as a diversifier within the Real Asset sleeve that has the potential to enhance risk-adjusted returns and mitigate economic shocks. It exhibits low correlation to equities and fixed income, reducing overall portfolio volatility, while its moderate inflation correlation (0.47) and commodity-linked income provide inflation protection. Historical performance suggests that Ranchland has outperformed other assets during periods of credit stress, recessions, and market bubbles, making it a stabilizing force in uncertain environments. Additionally, its long-term appreciation aligns with the characteristics of Farmland and Timberland, offering institutional investors an asset with return potential that is independent of traditional market cycles.
A summary of findings is as follows:
Ranchland has the potential to enhance portfolio diversification and return stability. Our analysis concludes the following: Ranchland exhibits strong positive correlation with Farmland (0.72) and Timberland (0.79), making it a natural fit within the Real Asset category. It is moderately correlated to inflation (0.47), offering inflation-hedging benefits superior to broader commodity indices. The inclusion of Ranchland improves portfolio efficiency, increasing both Sharpe and Sortino ratios while reducing portfolio drawdowns. It ranks among the top-performing asset classes during economic shocks, including inflationary spikes, recessions, credit crises, and periods following market overvaluations. Additionally, commodity-linked income from Ranchland provides further risk mitigation, balancing price volatility between crops, timber, and livestock. While liquidity is constrained in the short term, Ranchland aligns with other long-term real assets such as Farmland and Timberland, exhibiting stable appreciation with no historical loss over a three-year holding period. Passive income generation is compressed due to industry consolidation, but multiple exit strategies exist, validated by Farmland and Timberland markets. Given these characteristics, institutional portfolios should strongly consider Ranchland as a critical component of their Real Asset allocation.
Data and Methodology:
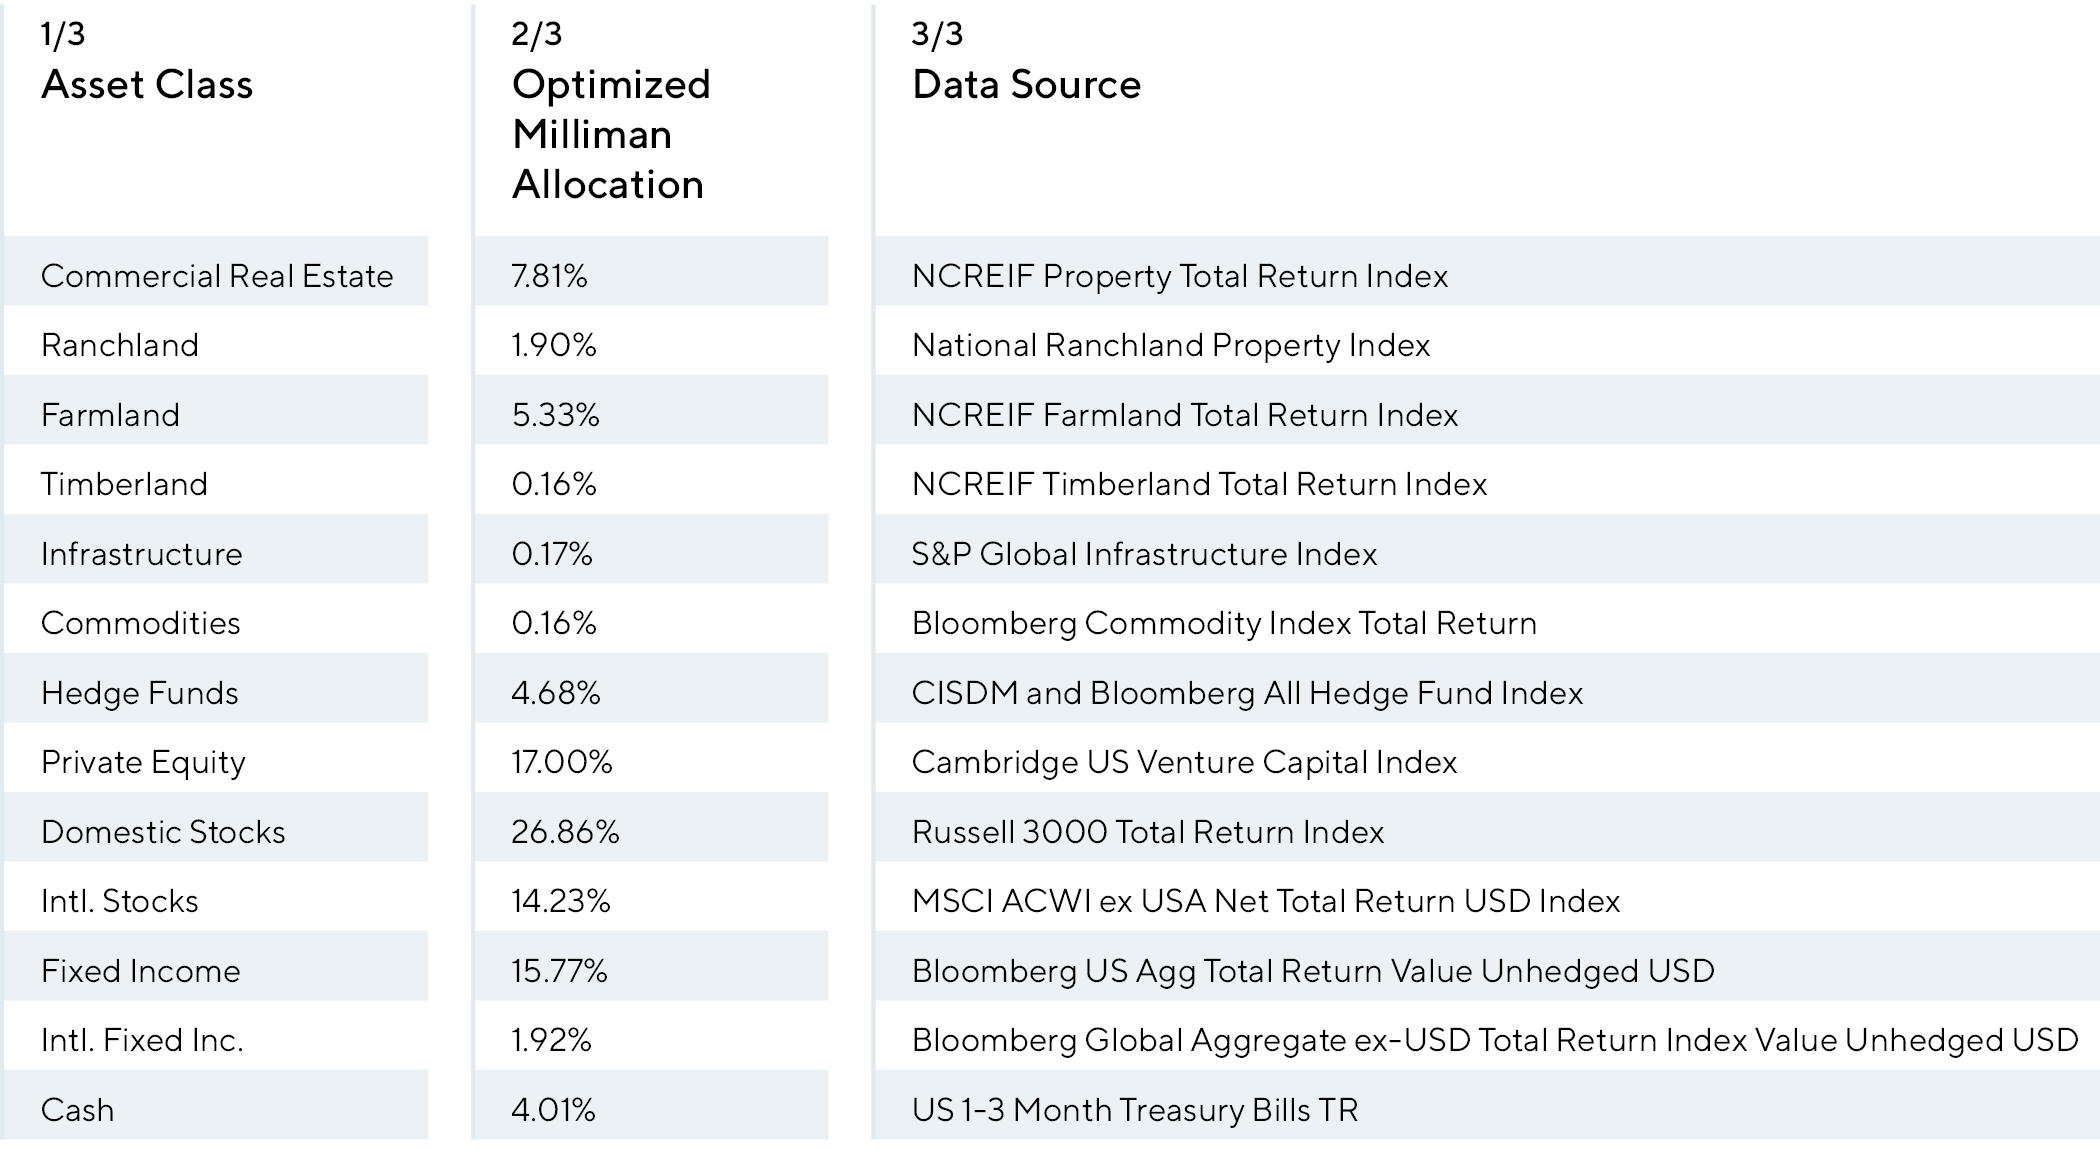
For the comparison to Ranchland for portfolio metrics such as expected return, standard deviation, maximum drawdown, and correlations, we used the 2023 Milliman Pension Fund Study as a proxy for “institutional portfolios”. For return data, we used widely accepted total return benchmark indices with available data going back to 1997 – the earliest common year where all data was available for the asset class benchmarks in our analysis. Our analysis period is between 12/31/1997 and 12/31/2023.
Table 1 below summarizes the asset classes included in the optimized Milliman Study paper, which can be downloaded here: https://ranchlandcp.com/using-heavy-tail-optimization-to-evaluate-the-2023-milliman-study-allocation/
The following sections provide a detailed analysis of Ranchland’s correlation, risk, efficiency, and liquidity characteristics, supporting the conclusions outlined above.
Correlation Analysis
Correlation to Other Assets
Ranchland is a strong diversifier when combined with a portfolio of public and private investments. During the lookback period, it exhibited moderate negative correlations to Domestic Equities, Hedge Funds, and both US and International Bonds. It exhibited moderate positive correlation Private Equity, Cash (T-bills) and Commercial Real Estate.
Correlations to Ranchland
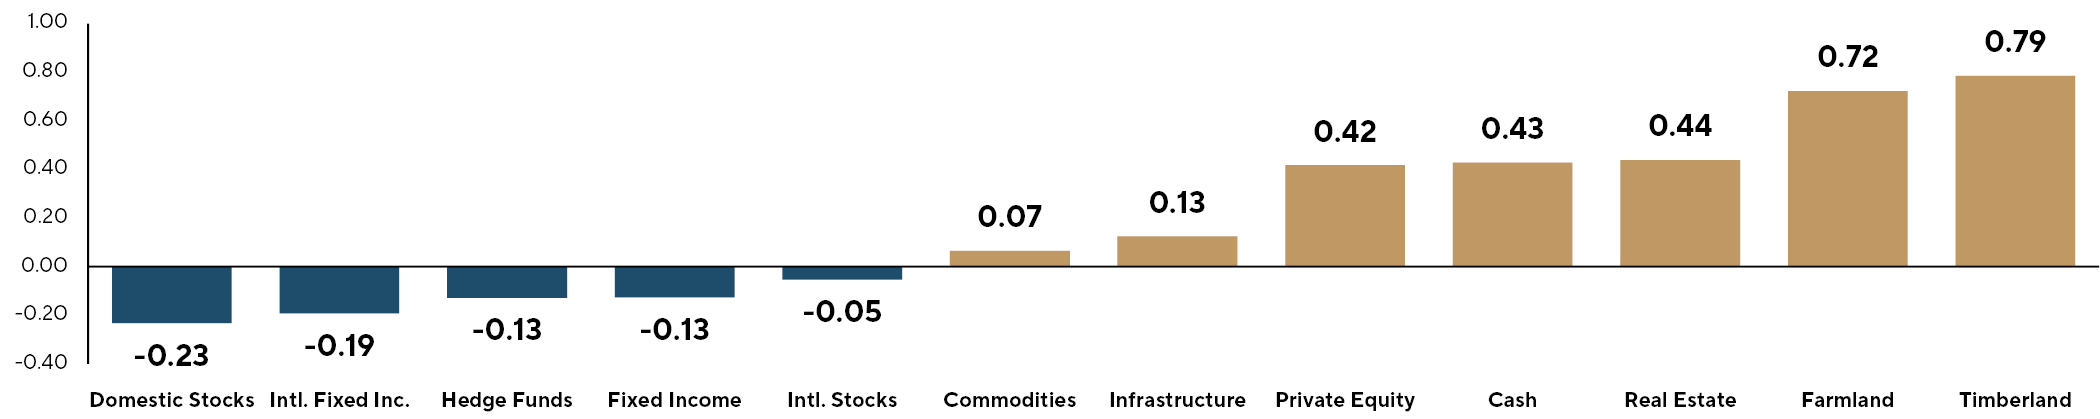
Unsurprisingly, it showed strong positive correlation to Farmland and Timberland at +0.72 and +0.79, respectively. Additionally, Ranchland’s correlation to the Milliman study’s portfolio (ex-Ranchland) equated to -0.025, indicating a high degree of diversification when added to a portfolio invested similar to the Milliman study allocation.
Correlation to Inflation
Ranchland has historically exhibited moderately positive correlation to US Inflation, as measured by CPI Inflation data. During the lookback, the correlation between Ranchland and Inflation was +0.47.
Correlations to CPI Inflation
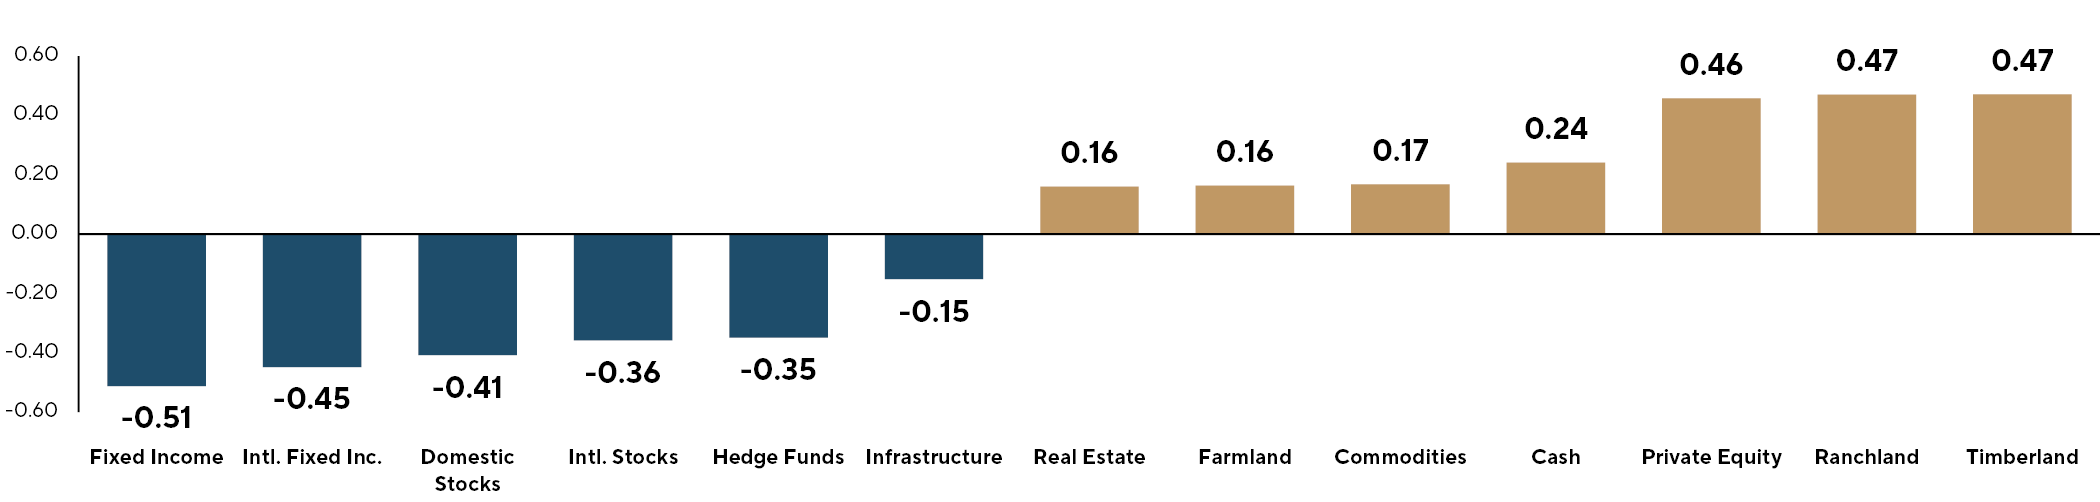
Ranchland and Timberland historically showed the strongest correlation to inflation among all asset classes included in the Milliman Study, outpacing Farmland significantly during the lookback period.
Commodity-Linked Return Correlations
A key motivating factor for large allocators to invest in Real Assets is their inflation hedging properties. To assess whether agricultural commodities provide a stronger hedge against inflation (when compared to a broader commodity index) through their direct commodity-linked returns, we analyzed the commodity return stream correlations to CPI Inflation:
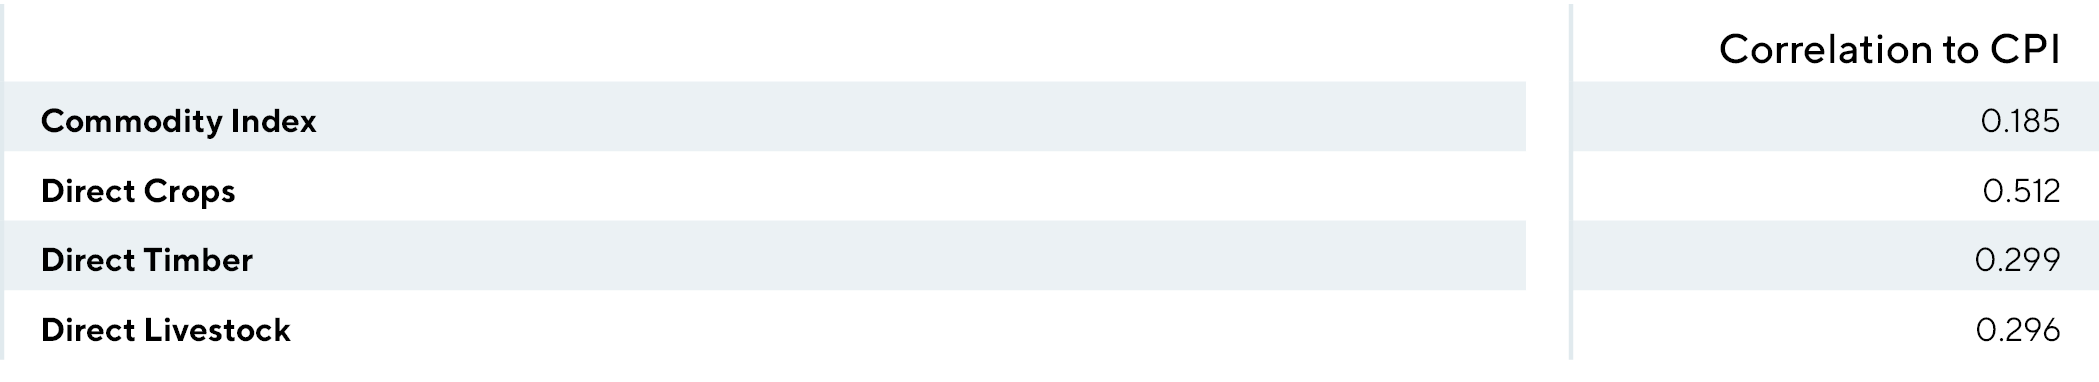
For allocators seeking hedges against inflation, investing in direct commodity-linked exposures to the three core Agricultural assets (such as owning and operating Farmland, Timberland, or Ranchland) were historically stronger hedges when compared to broader commodity buckets.
Portfolio Efficiency
We evaluated the change in portfolio efficiency when Ranchland is added to the Real Assets portfolio segment, and calculated two metrics for portfolio efficiency – the Sharpe ratio and Sortino ratio.
A common formula to evaluate if a new asset will improve the portfolios efficiency (measured by the Sharpe ratio) is to compare the new asset’s sharpe ratio with the existing portfolios sharpe ratio, adjusted for the correlation between the two ![]() . The figures from the analysis produced a historical Sharpe ratio for Ranchland equal to 0.65, Sharpe ratio of the Milliman allocation of 0.70, and a correlation between the two of -0.025. Thus, the addition of Ranchland to the existing Milliman allocation should improve portfolio efficiency, as 0.65 > -0.025 x 0.70.
. The figures from the analysis produced a historical Sharpe ratio for Ranchland equal to 0.65, Sharpe ratio of the Milliman allocation of 0.70, and a correlation between the two of -0.025. Thus, the addition of Ranchland to the existing Milliman allocation should improve portfolio efficiency, as 0.65 > -0.025 x 0.70.
To analyze the impact with the addition of Ranchland, we adjusted the Milliman Study allocation percentages for the Real Assets segment, adding 20.0% of Ranchland to the allocation. The corresponding weights of the original asset were adjusted downward by 20% of their original value.
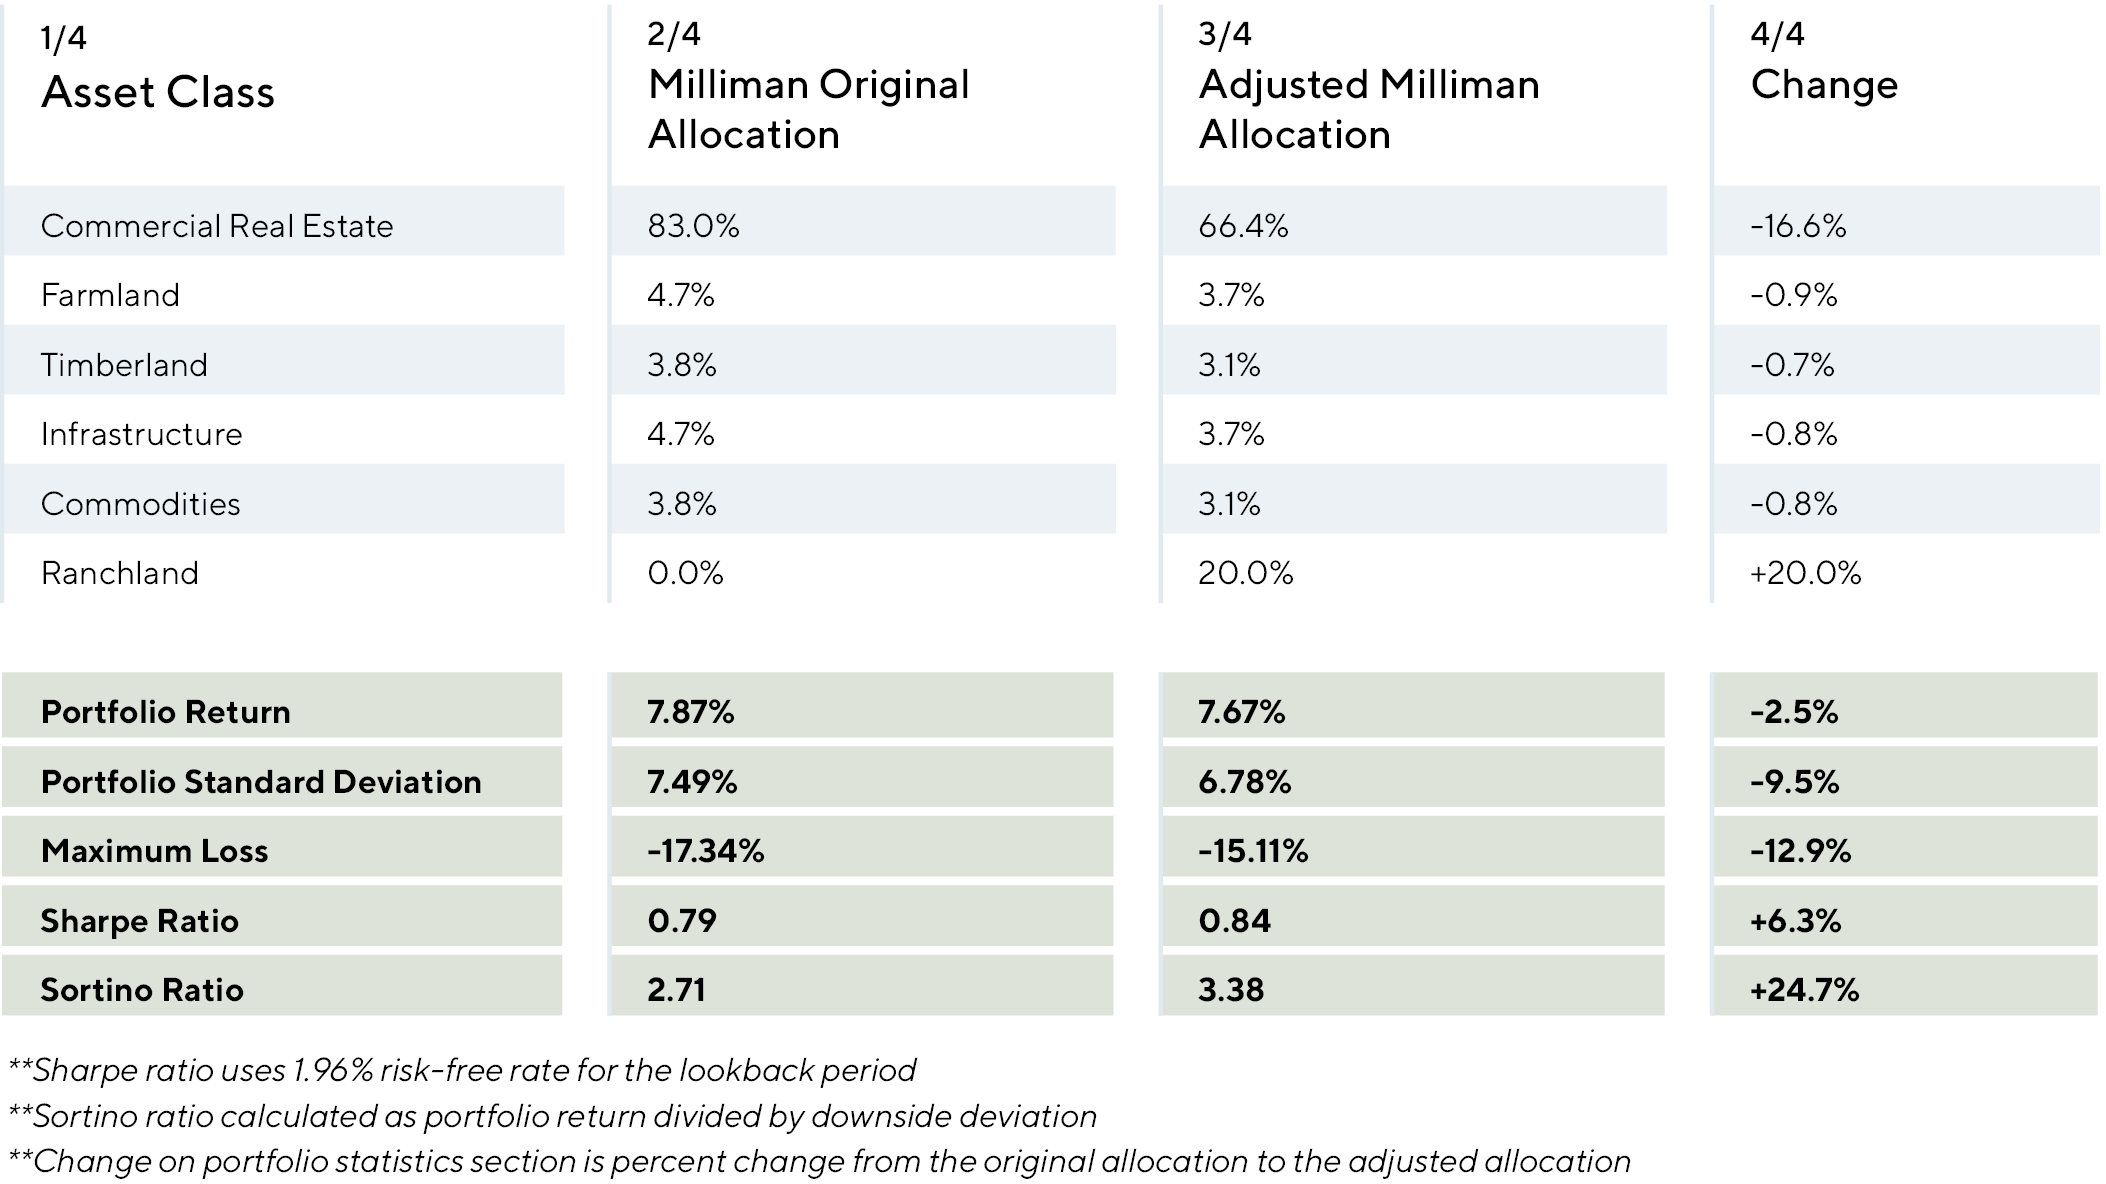
Given the diversification benefits outlined in the correlation section and the relatively low drawdown risk of Ranchland compared to Commercial Real Estate and Commodities, it is not surprising that the portfolio segment saw a meaningful improvement in portfolio efficiency.
Risk Analysis
Drawdown Risk Analysis
For Ranchland, the maximum annual loss was the third lowest among risk assets across the comparison indexes (excluding cash), equating to -6.2% (2009):
Worst Historical Loss (Annual)
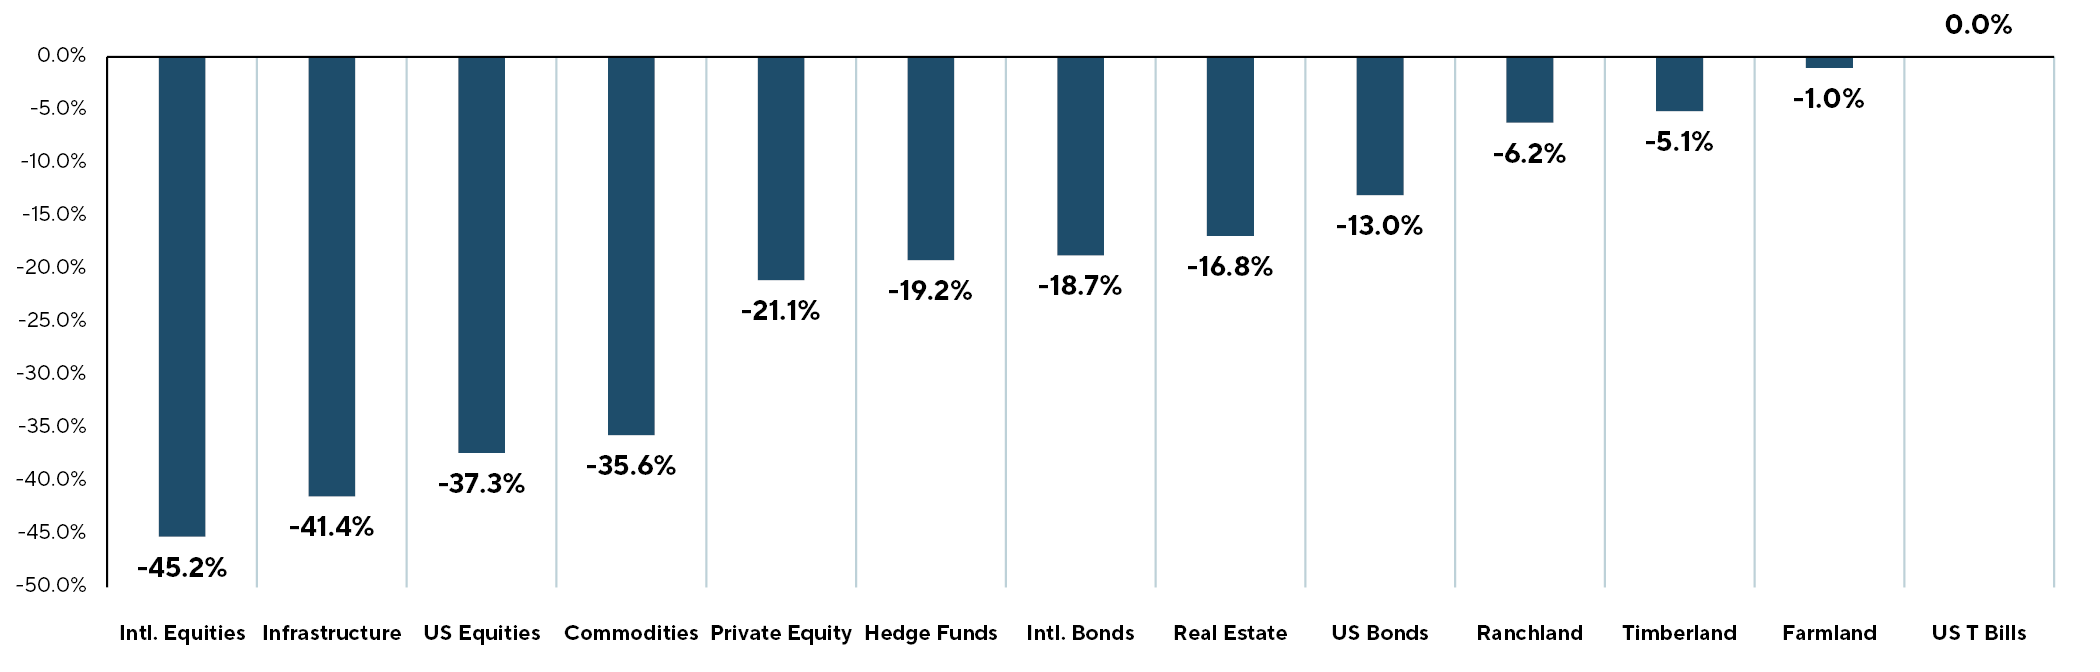
Ranchland has historically demonstrated consistent positive returns, similar to Farm and Timberland. Portfolio stability and preservation of capital during periods of heightened economic stress are key benefits all three agricultural related asset classes share.
Factor Risk Exposures
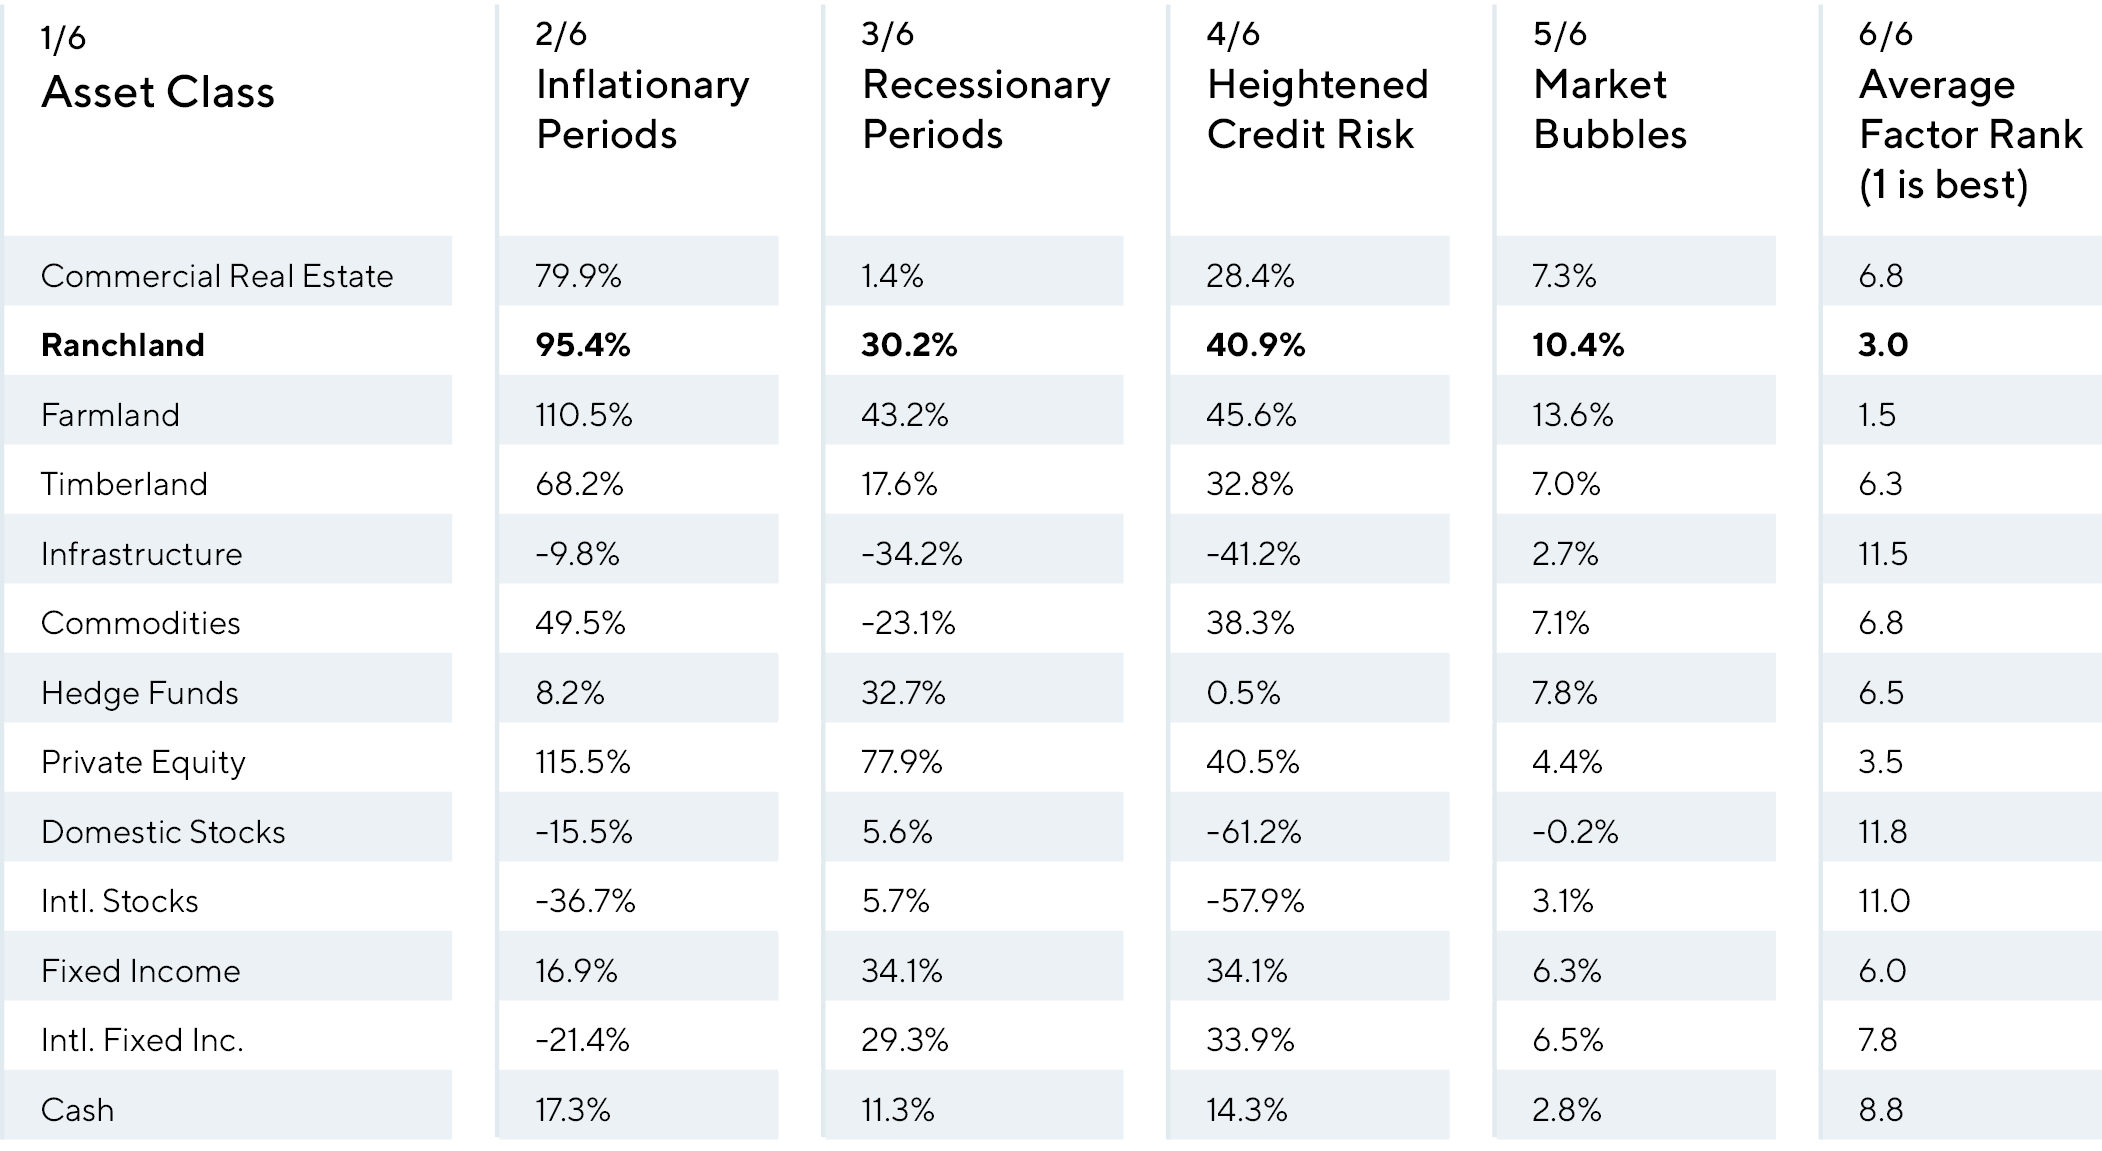
To evaluate how ranchland investments behave relative to key macroeconomic risks, we compared performance among the risk assets included in the Milliman study during inflationary periods, recessionary periods (rising unemployment and declining GDP), credit risk events (widening credit spreads), and market bubbles (periods of historically high equity valuations followed by sharp market declines).
The table below indicates that Ranchland is a portfolio stabilizer during stressed economic conditions, which is consistent with the findings in the correlation and drawdown analyses conducted above.
Out of the 13 asset classes included in the Milliman allocation, Ranchland ranked 2nd overall, and the following summarizes how Ranchland ranked in each factor risk scenario:
- Ranchland ranked 3rd (out of 13 assets in the Milliman study) for performance during inflationary periods.
- Ranked 5th during recessionary periods.
- Ranked 2nd during both credit risk events and market bubbles.
A few notes to the chart above:
Inflationary Periods: defined as any year in the lookback period when inflation was above 3.0% and increased from the previous year. The figure represents the total return of the asset class during periods when this criteria was met. For example, Commercial Real Estate totaled 79.9%, which is the sum of the annual returns it generated in 2000, 2005, 2006, 2008, 2011, 2021 and 2022.
Recessionary Periods: defined as any year(s) in the lookback period that had both declining GDP and rising unemployment – considered recessionary indicators. This occurred in 2001, 2007, 2008, 2009 and 2020. The figure calculation is also the sum of annual returns for the asset class during those years.
Rising Credit Risk Periods: to proxy “credit risk”, we compared the spread on the US 5-year Treasury Bond and yield on AAA rated corporate bonds to compare similar-duration assets, and calculated the years when credit spreads increased more than one standard deviation from the average. In our analysis, this produced four periods where spreads increased year over year beyond this threshold (+78 basis point increase in credit spreads), which were 2000, 2002, 2007 and 2008. The figure calculation is also the sum of annual returns for the asset class during those years.
Market Bubbles: we evaluated the performance of asset classes during periods of significant overvaluations within the equity market. We used the Case-Shiller Cyclically Adjusted Price-to-Earnings (CAPE) ratio for this analysis, only including market environments when the CAPE ratio peaked after a steadily rising period (at least 5 years), then saw a sharp decline. Since 1939, this criteria was met only three times, in 1966, 1999, and in 2021. The only period relevant to our lookback period was 1999, where we could calculate forward 10-year returns on each asset class. The figures represented in the Market Bubble column are the average annual returns for the 10-year period after the peak of the CAPE ratio in 1999 (the years 2000 through 2009).
In summary, Ranchland historically has demonstrated attractive performance enhancing characteristics during periods of heightened economic and market risks.
Commodity-Linked Income Volatility
We analyzed the annual price changes of livestock, crops, and timber to understand the relationship between their commodity price movements.
The graph below shows a comparison of prices since 1998, which normalizes annual price changes into commodities indexes with a base value of 100:
Crops Timber and Livestock Growth in Prices Over Time
Base Year Index = 1998
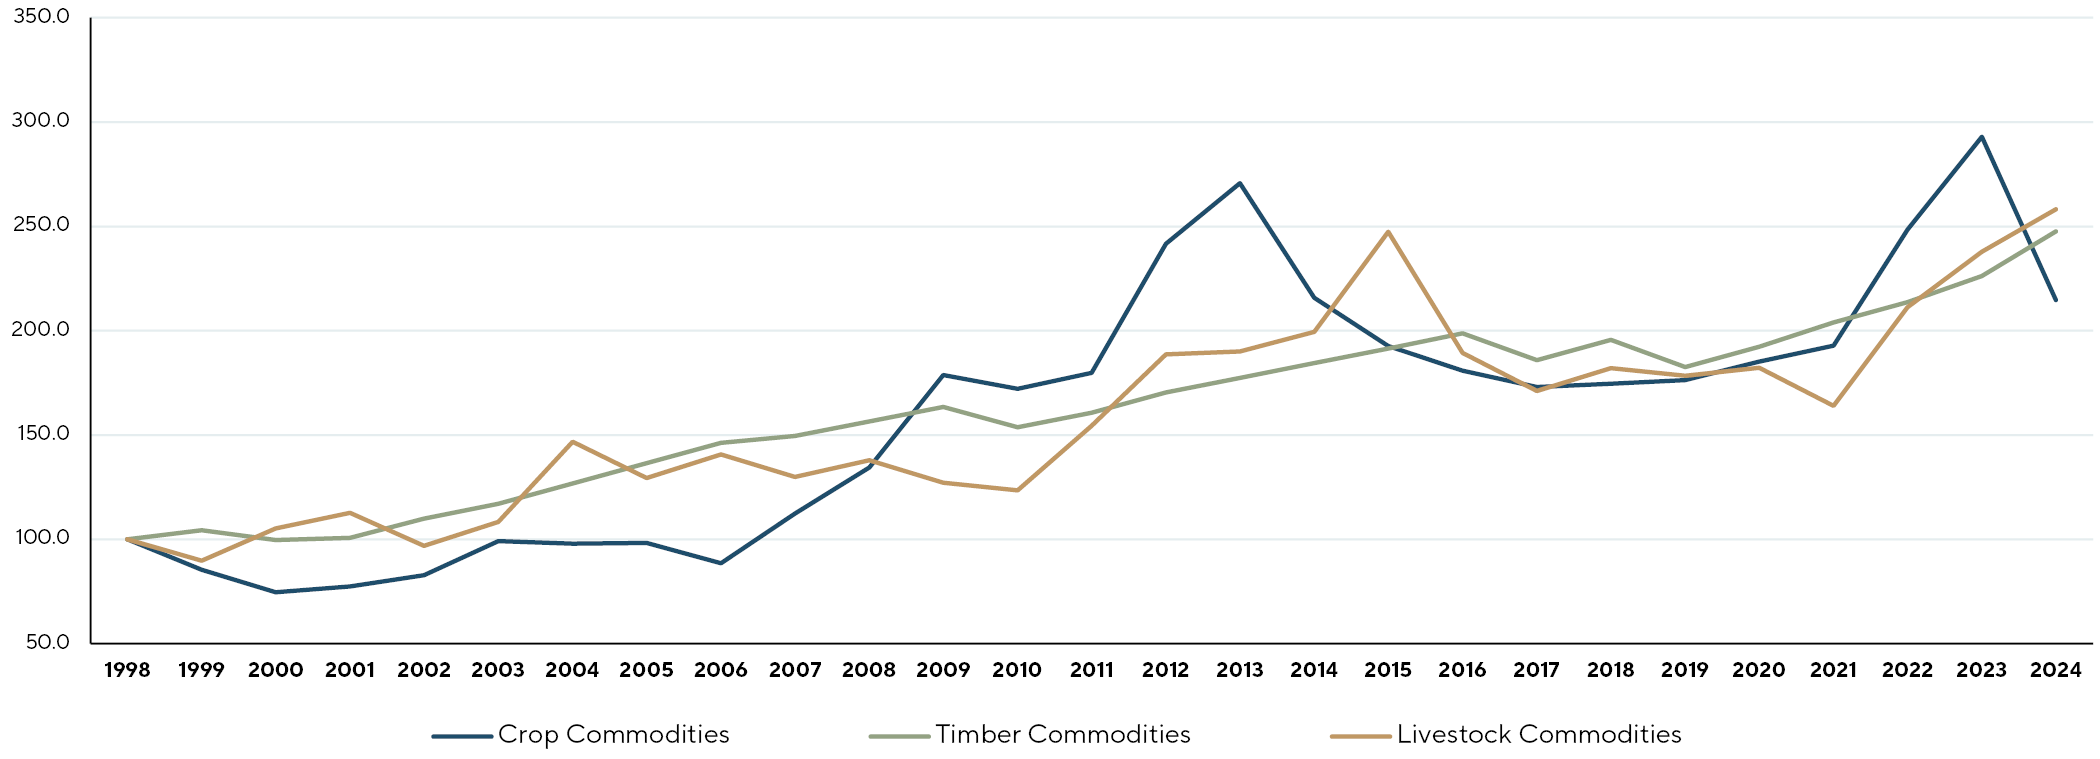
Timberland demonstrated the lowest volatility in annual price changes during the study, with a standard deviation equating to 4.4% compared to crops and livestock at 15.7% and 14.6%, respectively. The average annual price changes (simple average – considered a measure of commodity price inflation) were 3.7% for crops, 3.6% for timber, and 5.4% for livestock.
Gaining exposure to true commodity-linked returns has been a factor in why large allocators have invested into Farmland and Timberland over the past 25 years. Crops, timber, and livestock are not perfectly correlated as evidenced by the chart above.
For allocators with existing exposures to Farmland and Timberland (and by extension, their underlying commodity-linked exposures), investments with a direct link to returns from cattle markets could provide additional portfolio benefits and dampen return volatility within the income contributions of total returns.
Below is a summary of rolling 10-year price correlations of crops and timber against livestock, and starting in 1998 through 2024:
Rolling Year Correlations to Livestock Commodities
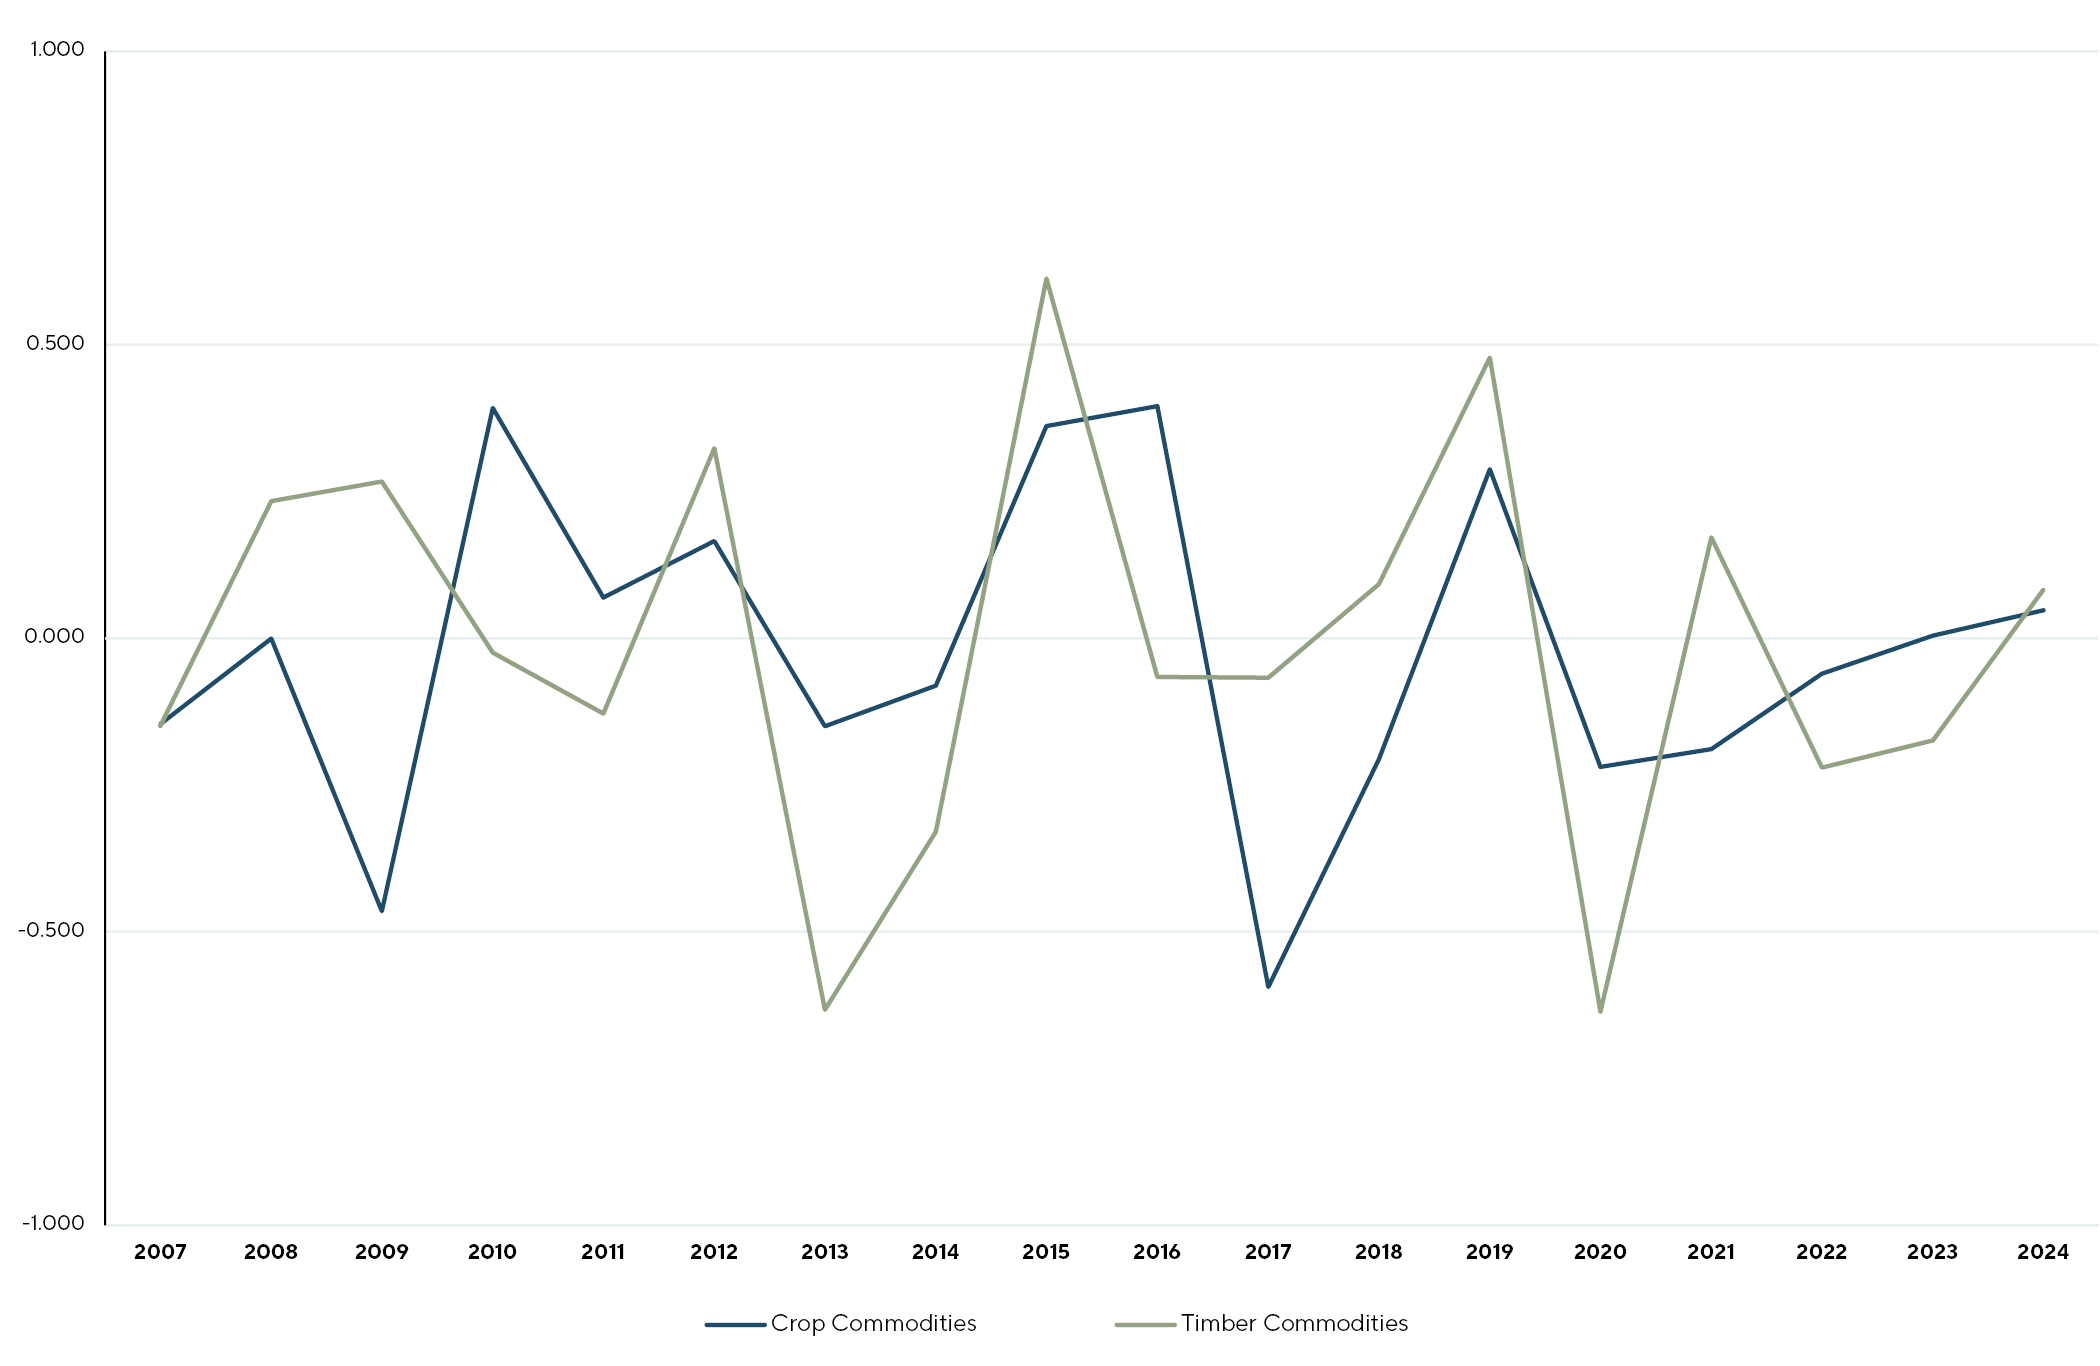
In summary, investors with return exposures to crop and timber commodity income historically benefited from adding investments with direct livestock-linked returns. Livestock offers the potential to dampen return volatility by reducing the annual risk in commodity-linked income, without materially impacting the expected return (more predictable annual income with lower probability of negative earning years). Crops, timber, and livestock all provided stronger hedges against inflation than broader commodity index exposures.
Ranchland Liquidity
Long-Term Price Appreciation
Ranchland should be considered a long-term investment, similar to other Agricultural investments such as Farmland or Timberland. As a Real Asset categorized within the Natural Resources category, Ranchland benefits from longer hold periods. Ongoing liquidity via current income is comparable, albeit slightly less, than Timberland and Farmland.
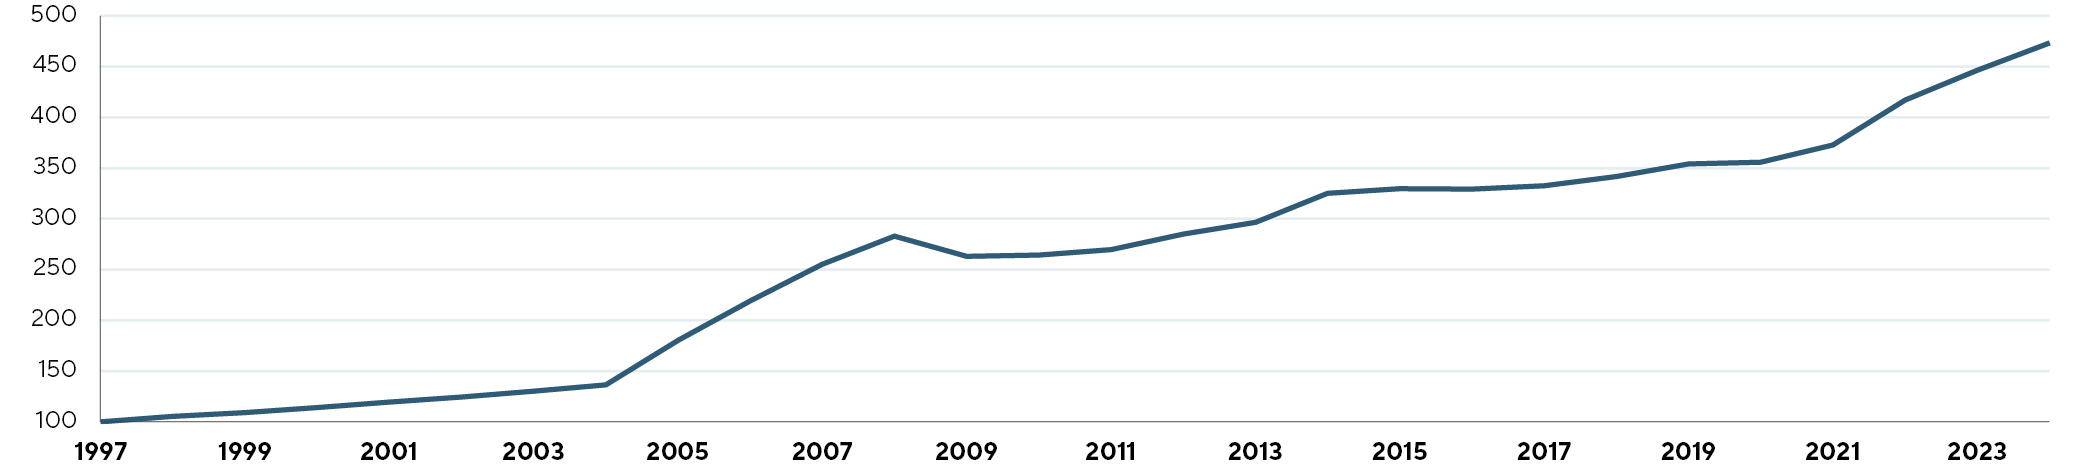
Ranchland has historically demonstrated stable price appreciation, with only one negative year since the inception of the index in 1997:
Historical Price Appreciation National Ranchland Property Index® PR
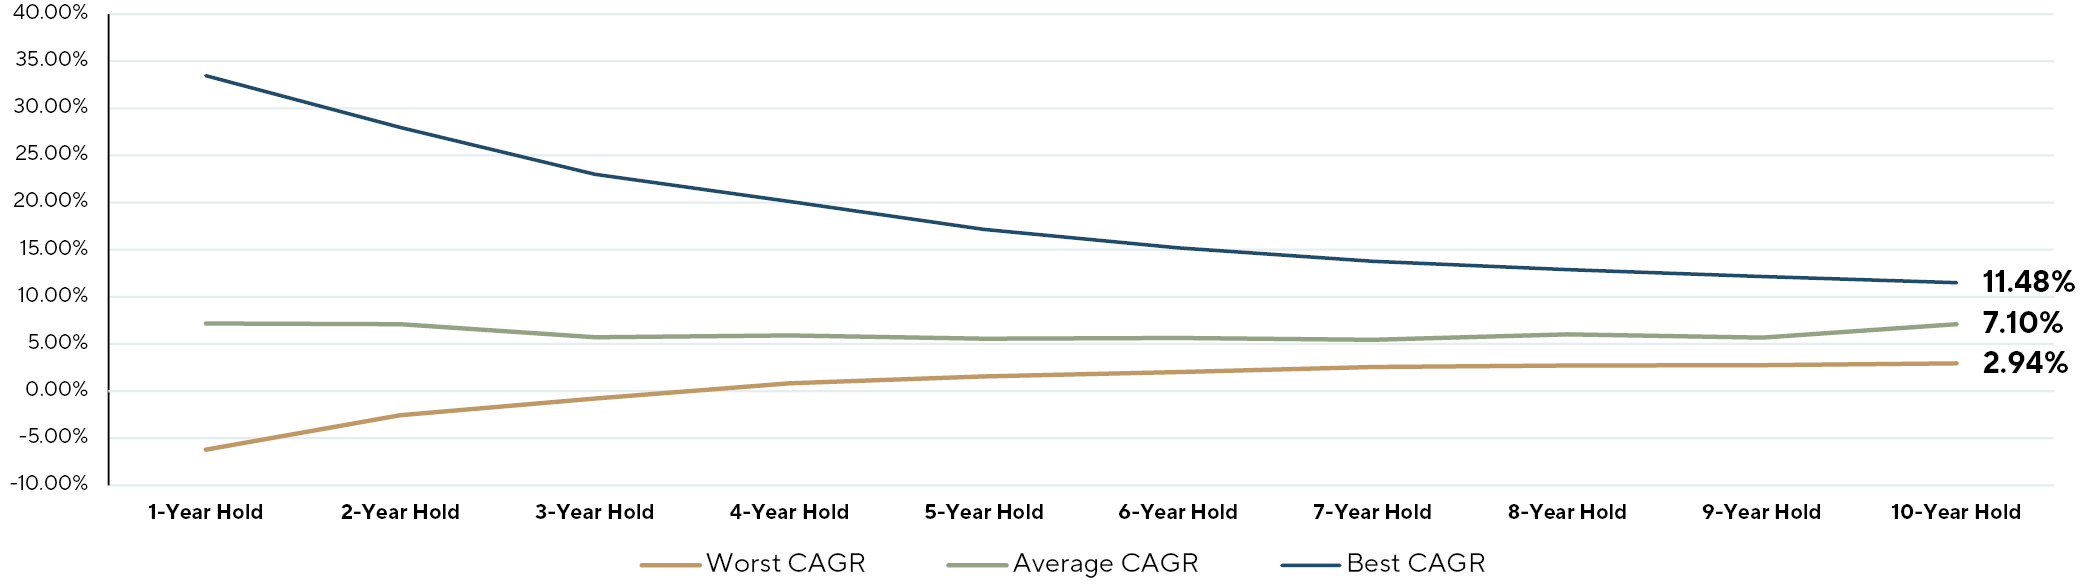
When held for 3 years or more, Ranchland historically never experienced a negative holding period return, with average annual returns ranging between 2.9% (worst 10-year holding period growth) and 11.5% (best 10-year holding period growth):
Compound Annual Growth Rates by Hold Period
Passive Income
Income distributions from Ranchland vary wildly depending on the type of landowner. For passive Ranchland investors who purchase the land and lease out operations (as reflected in the National Ranchland Property Index®), income potential is limited with fixed lease structures most common.
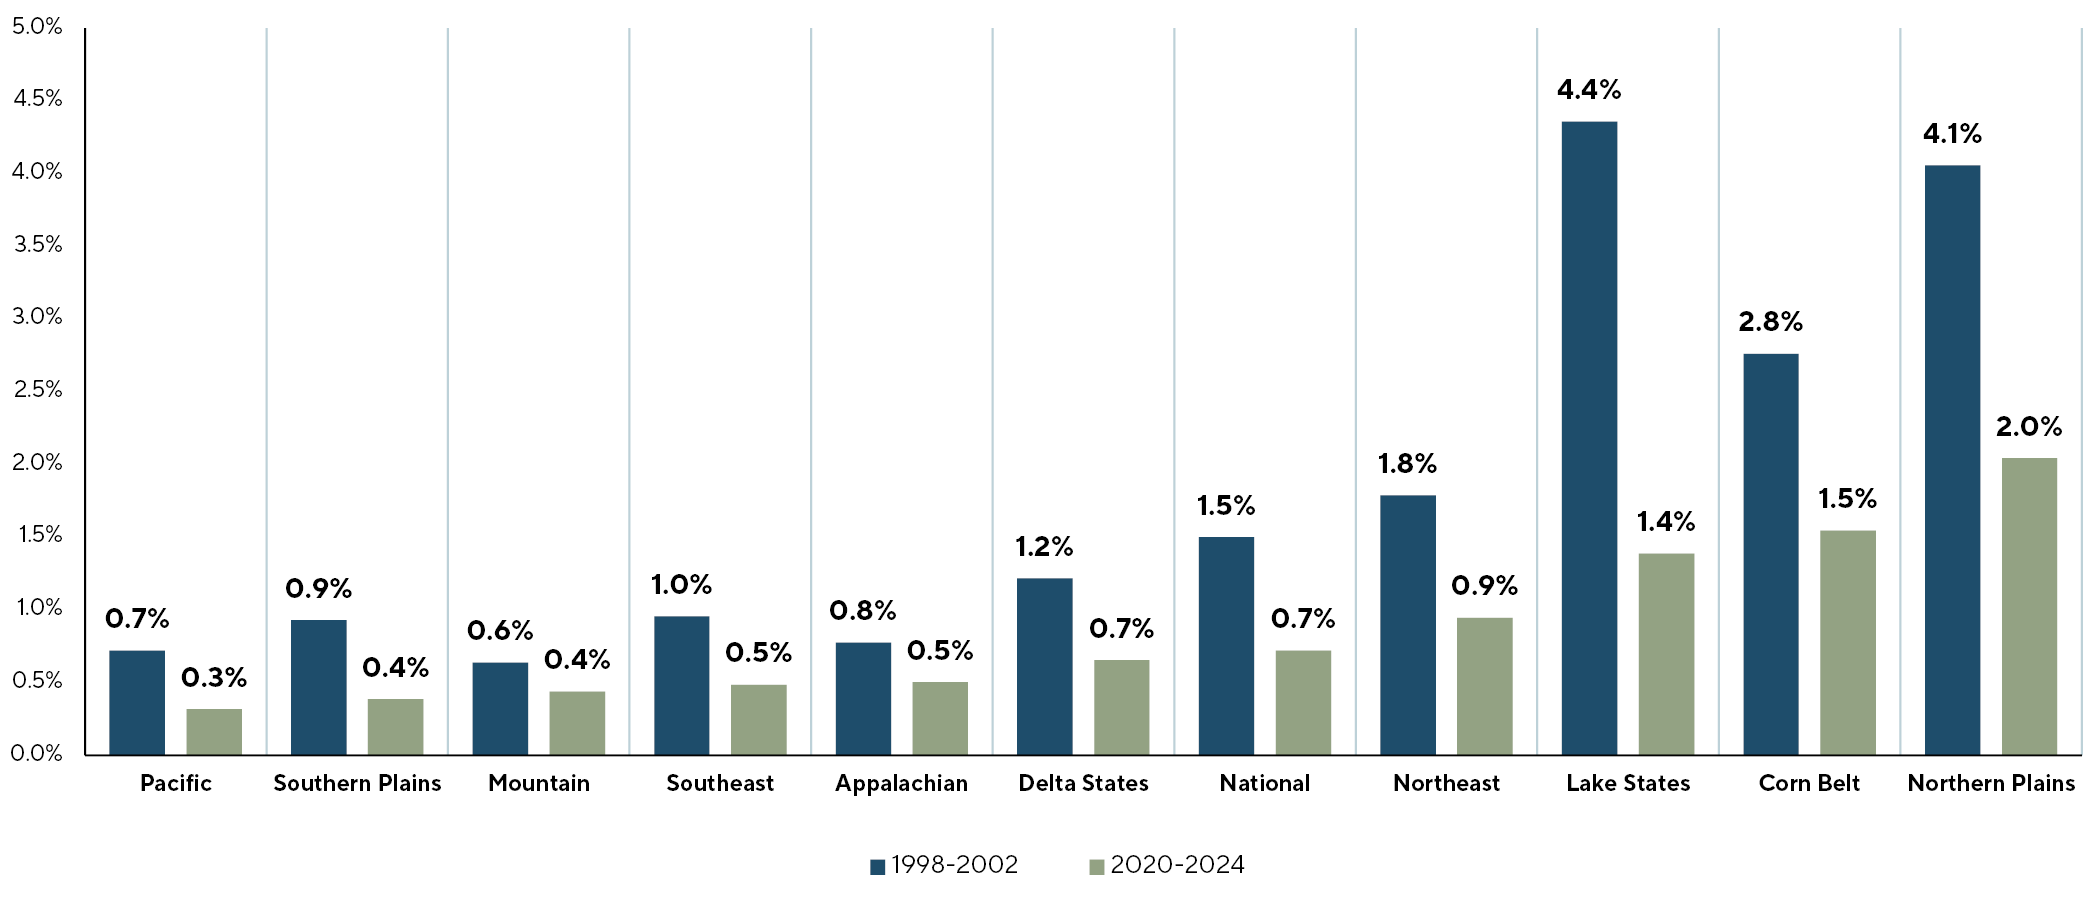
Based on USDA cash rent data, the average lease income to a passive Ranchland owner equated to 0.99% between 1998 and 2024; however, with consolidation in the meat packing industry and less bargaining power of livestock producers, average annual lease income (on a 5-year moving average basis) has declined to 0.72%.
Cash rents vary by region, with the Northern Plains (ND, SD, NE, KS) capturing highest average annual lease income at 2.04%, and the lowest belonging to the Pacific Region (WA, OR, CA) at 0.32%.
The table below summarizes the average annual cash income represented as an income yield to a Ranchland owner, comparing the 5-year averages from 1998-2002 (first five years of lookback) and 2020-2024 (most recent five years):
5-Year Average Income Yields (Cash Lease)
In summary, Investors in Ranchland generate liquidity through both current income, and long-run appreciation in land values which are recognized once the investment is sold.
Yields on operating leases (by way of passive ownership – buying land and leasing it out to a professional operator) have declined since the late 1990s in part due to the consolidation in the US meat packing industry and rising land prices, which is summarized in our paper, The Changing Landscape of Ranchland Ownership: Understanding the Forces Behind a Generational Land Transfer.
Active management creates the potential to generate additional income streams above passive ownership. The yield figures above represent purely passive ownership, and do not reflect the additional revenue streams ranches can generate if actively operated such as higher livestock production through better grazing management, hunting and fishing lease revenue, recreational revenues, renewable energy leases, biodiversity and conservation credits, or market premiums for sustainability. Please see our research paper, “Active Ranchland Management: The Case for Higher Returns”, for a review on how active land management has the potential to drive higher returns above passive ownership.
Exit Approaches
Ranchland investments provide multiple liquidity pathways, similar to other agricultural and real asset classes such as Farmland and Timberland. Traditional exit routes for individual property owners often include sales to neighboring ranchers seeking expansion or to investors interested in agricultural production.
The potential for an exit into a publicly traded REIT structure is also a viable consideration. As of this writing, Agricultural-related REITs currently represent over $30 billion in market capitalization, with specialized REITs for Farmland and Timber demonstrating established liquidity pathways for real asset investments. As the market for institutional ranchland investment matures, structured roll-ups and REIT conversions could provide an attractive liquidity option for scaled portfolios.
Conclusion
Ranchland has the potential to enhance portfolio diversification, improve risk-adjusted returns, and provide inflation protection. Historical data shows low correlation to traditional assets, resilience during economic downturns, and stable long-term appreciation. While liquidity is long-term, multiple exit strategies exist, and commodity-linked income offers additional risk mitigation. The findings support its consideration alongside other investment opportunities in the Natural Resources sleeve of Real Assets.
IMPORTANT INFORMATION
Copyright© Ranchland Capital Partners®, LLC 2024. All rights reserved.
This material is proprietary and may not be reproduced or distributed without Ranchland’s prior written permission. It is delivered on an “as is” basis without warranty or liability. Ranchland accepts no responsibility for any errors, mistakes, or omissions or for any action taken in reliance thereon. All charts, graphs, and other elements contained within are also copyrighted works and may be owned by Ranchland or a party other than Ranchland. By accepting the information, you agree to abide by all applicable copyright and other laws, as well as any additional copyright notices or restrictions contained in the information.
The views and information provided were created at various dates in time and unless otherwise indicated, are subject to frequent changes, updates, revisions, verifications, and amendments, materially or otherwise, without notice, as data or other conditions change. There can be no assurance that terms and trends described herein will continue or that forecasts are accurate. Certain statements contained herein are statements of future expectations or forward-looking statements that are based on Ranchland’s views and assumptions as of the date hereof and involve known and unknown risks and uncertainties that could cause actual results, performance, or events to differ materially and adversely from what has been expressed or implied in such statements. Forward-looking statements may be identified by context or words such as “may, will, should, expects, plans, intends, anticipates, believes, estimates, predicts, potential, or continue” and other similar expressions. Neither Ranchland, its affiliates, nor any of Ranchland’s or its affiliates’ respective advisers, members, directors, officers, partners, agents, representatives, or employees, or any other person, is under any obligation to update or keep current the information contained in this document.
This material is for informational purposes only and is not an offer or a solicitation to subscribe to any fund and does not constitute investment, legal, regulatory, business, tax, financial, accounting, or other advice or a recommendation regarding any securities of Ranchland, of any fund or vehicle managed by Ranchland, or of any other issuer of securities. No representation or warranty, express or implied, is given as to the accuracy, fairness, correctness, or completeness of third-party sourced data or opinions contained herein, and no liability (in negligence or otherwise) is accepted by Ranchland for any loss howsoever arising, directly or indirectly, from any use of this document or its contents, or otherwise arising in connection with the provision of such third-party data.
Note on the Crop and Timber commodity prices: To develop a reasonable comparison among the three commodities, we developed a Crop Price index (“RCP Crop Price Index”) that considers the largest crop categories by production across Row Crops and Permanent Crops targeted by the largest Farmland Funds Globally. We used the USDA National Agricultural Statistics Service (NASS) database for historical pricing, and developed a production-weighted index to represent a basket of crops that produce the income return in diversified Farmland portfolios.
For Timber prices, the FRED database publishes a producer price index series that could proxy timber prices received; however, to evaluate pricing data more closely related to actual prices received by Timberland owners, we developed a Timber Price Index (“RCP Timber Price Index”) using multiple reliable data sources including the State Forestry service, third-party pricing agencies, and prices received by Timber REITs (Potlatch; Weyerhaeuser; Rayonier) based on annual 10-k data. We used Timber prices versus lumber given most landowners are not integrated to produce lumber, and primary cash receipts received by Timberland owners are priced against Timber, not processed logs or lumber. Further, we used available pricing for Delivered Mill and Stumpage pricing as these account for 70-80% of Timberland owner income historically. We used widely available Livestock price data from the USDA and CME feeder and slaughter cattle futures prices.
Featured Articles

Using Heavy Tail Optimization to Evaluate the 2023 Milliman Study Allocation

The Relationship between Cattle, Sustainability, and Ecosystem Function

Why Now?

Hunting and Conservation: An Integral Relationship

Ranchland Economics under the New Trump Administration: An Initial Look.
